DIpil Das
This report presents Coresight Research’s updated Retail Robustness Index (RRI), which evaluates the 100 largest US retailers (by revenue) on their ability to weather the dramatic demand shifts due to the coronavirus crisis in the US.
We evaluate retailers based on financial health, sales capacity, product mix and management tenure.
Discussion
In this update, the average score across the full index increased by nearly four points, to 50 from 46, primarily owing to increases in the percentage of stores open. We anticipate further increases in sales capacity when retailers report their fiscal second-quarter results, plus changes in financial health due to the combination of capital raises, steep losses while closed and continuing weak consumer demand. Two retailers filed for bankruptcy since our previous report (plus Tailored Brands following the writing of this report, which will be factored into the next update). We anticipate that filings will remain at a high level as retailers update their financial projections based on current demand levels.
Monthly Changes of Overall Retail Robustness Index
Figure 1 shows the changes in the overall RRI and its components since March 2020.
[caption id="attachment_113879" align="aligncenter" width="700"]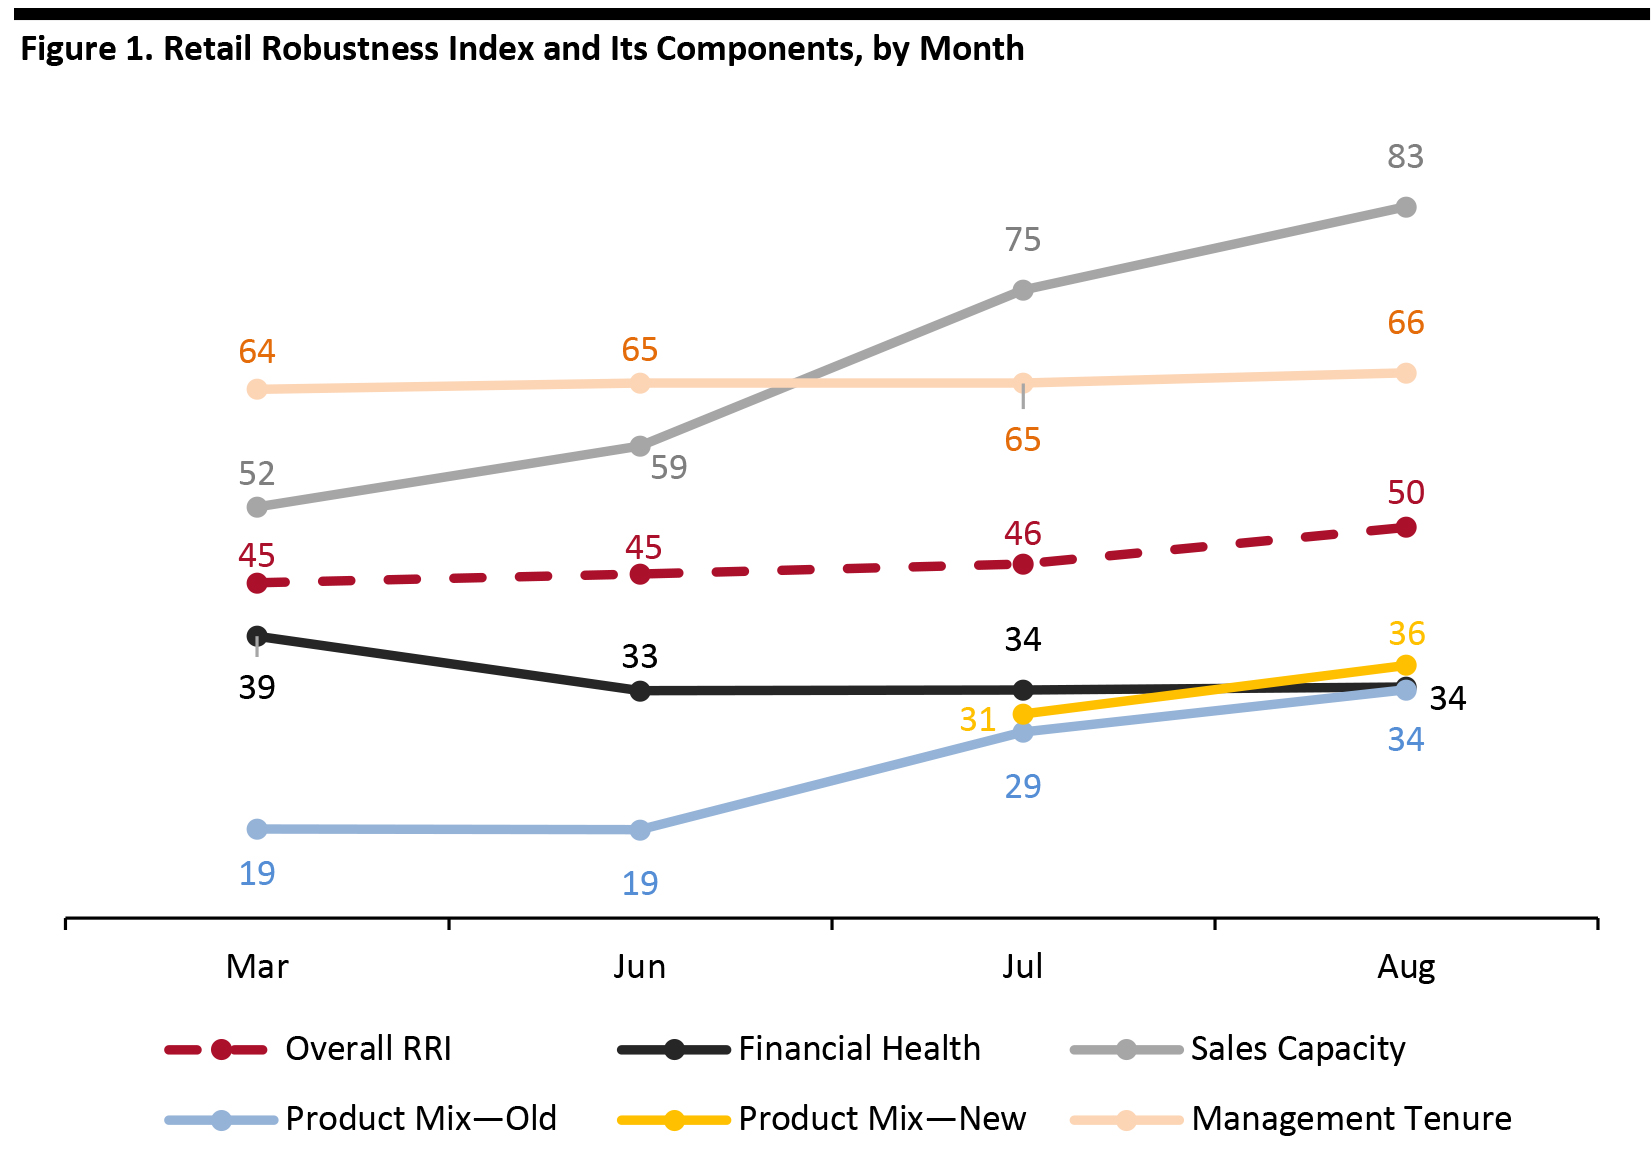 Note: The index includes new weightings and methodologies for sales capacity and product mix starting in July 2020.
Source: Coresight Research [/caption] We can see that the main driver of higher RRI scores has been sales capacity, which has increased over the past two months due to store reopenings. September RRI Outlook The second-quarter 2020 earnings season is just starting, which will offer new data on financial health and sales capacity. Financial health is likely to fluctuate due to raises offset by substantial losses as stores largely remained closed during the beginning of the quarter, in addition to greatly reduced sales volumes after reopening. Sales capacity is likely to increase further, approaching full reopenings, offset by stores that have had to re-close due to a resurgence in the number of coronavirus cases. Product mix is likely to continue to skew toward food and away from apparel and beauty products as many consumers work from home or shelter at home. Top 10 Retailers by RRI Ranking Figure 2 presents the 10 retailers that rank highest in our index as of the start of August 2020. The changes in the top 10 RRI scores were modest due to a lack of updated financial data and little change in the number of stores open. As outlined above, we expect greater changes to the figures in next month’s index update, following second-quarter earnings reports, which began in late July. In this index update, we added Qurate (formerly Liberty Interactive, which includes Home Shopping Network, QVC and Zulily) and Ulta Beauty to replace Ascena Retail Group and RTW RetailWinds, which filed for bankruptcy protection. (Tailored Brands also filed for bankruptcy protection, subsequent to the writing of this report—we will include this in the next update.)
Figure 2. Changes in Retail Robustness Index: Top 10 Retailers [wpdatatable id=361 table_view=regular]
Note: Figures may differ due to rounding. Source: Coresight Research Retail Robustness by Segment The figure below shows the RRI by general segment. [caption id="attachment_113880" align="aligncenter" width="700"]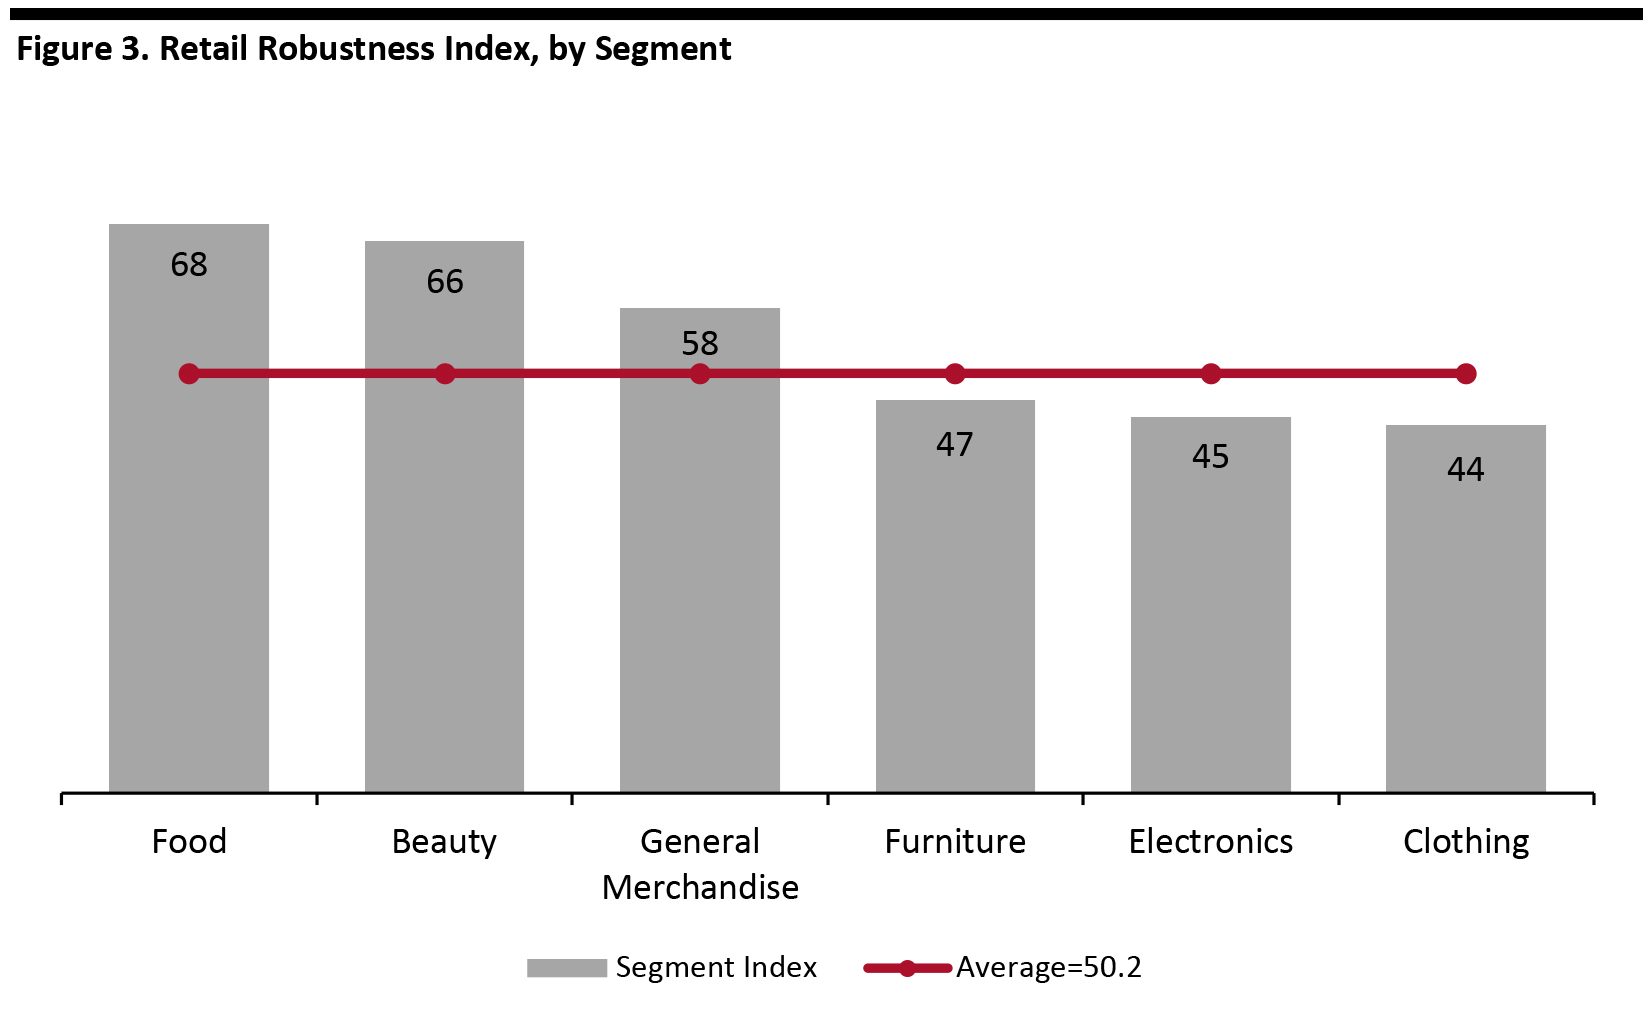 Source: Coresight Research[/caption]
The average score across the full index increased to 50.2 from 45.8 in July.
Source: Coresight Research[/caption]
The average score across the full index increased to 50.2 from 45.8 in July.
Figure 4. Coresight Research Retail Robustness Index: Components and Weighting [wpdatatable id=362 table_view=regular]
Source: Coresight Research A more detailed discussion of the index methodology is included in the appendix of this report. Additional notes on the Coresight Research Coronavirus Retail Robustness Index:
Figure 5. Coresight Research Coronavirus Retail Robustness Index: Full List [wpdatatable id=363 table_view=regular]
Note: Figures may fluctuate due to rounding * Tailored Brands for bankruptcy protection subsequent to the writing of this report. Source: Company reports/S&P Capital IQ/Coresight Research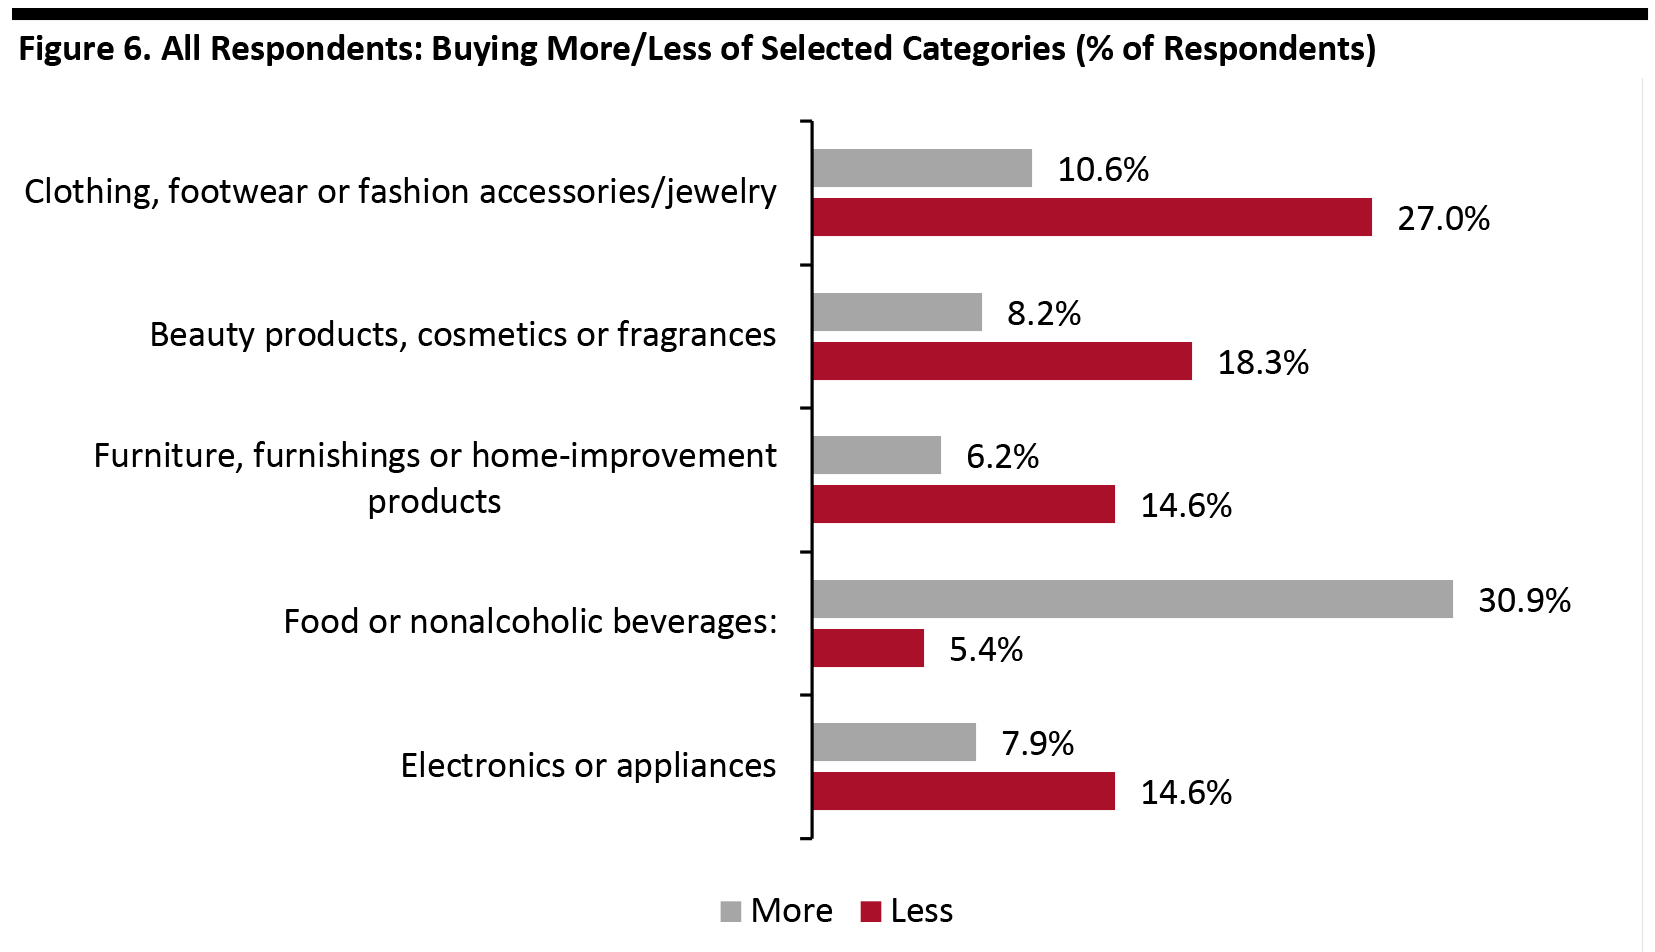 Base: US Internet users aged 18+
Source: Coresight Research [/caption]
Note: The index includes new weightings and methodologies for sales capacity and product mix starting in July 2020. Source: Coresight Research [/caption] We can see that the main driver of higher RRI scores has been sales capacity, which has increased over the past two months due to store reopenings. September RRI Outlook The second-quarter 2020 earnings season is just starting, which will offer new data on financial health and sales capacity. Financial health is likely to fluctuate due to raises offset by substantial losses as stores largely remained closed during the beginning of the quarter, in addition to greatly reduced sales volumes after reopening. Sales capacity is likely to increase further, approaching full reopenings, offset by stores that have had to re-close due to a resurgence in the number of coronavirus cases. Product mix is likely to continue to skew toward food and away from apparel and beauty products as many consumers work from home or shelter at home. Top 10 Retailers by RRI Ranking Figure 2 presents the 10 retailers that rank highest in our index as of the start of August 2020. The changes in the top 10 RRI scores were modest due to a lack of updated financial data and little change in the number of stores open. As outlined above, we expect greater changes to the figures in next month’s index update, following second-quarter earnings reports, which began in late July. In this index update, we added Qurate (formerly Liberty Interactive, which includes Home Shopping Network, QVC and Zulily) and Ulta Beauty to replace Ascena Retail Group and RTW RetailWinds, which filed for bankruptcy protection. (Tailored Brands also filed for bankruptcy protection, subsequent to the writing of this report—we will include this in the next update.)
Figure 2. Changes in Retail Robustness Index: Top 10 Retailers [wpdatatable id=361 table_view=regular]
Note: Figures may differ due to rounding. Source: Coresight Research Retail Robustness by Segment The figure below shows the RRI by general segment. [caption id="attachment_113880" align="aligncenter" width="700"]
Source: Coresight Research[/caption]
The average score across the full index increased to 50.2 from 45.8 in July.
- Food ranks the highest due to its high product mix and availability, since it is an essential category.
- Beauty ranks above average due to the inclusion of essential health and wellness products in this category.
- Furniture, electronics and clothing rank below average due to consumers’ currently purchasing less in these product categories.
- Carter’s (increase of 17 points): Higher scores for financial health and sales capacity.
- Fossil Group (increase of 15 points): Higher score for sales capacity.
- National Vision (increase of 15 points): Higher scores for financial health and sales capacity.
- Sally Beauty (increase of 15 points): Higher scores for financial health and sales capacity.
- Skechers (increase of 13 points): Higher score for sales capacity.
Figure 4. Coresight Research Retail Robustness Index: Components and Weighting [wpdatatable id=362 table_view=regular]
Source: Coresight Research A more detailed discussion of the index methodology is included in the appendix of this report. Additional notes on the Coresight Research Coronavirus Retail Robustness Index:
- The index is a model for retailer robustness based on selected weights and factors and relies on certain assumptions and estimates.
- The environment is evolving dramatically at a fast pace: Figures are thought to be accurate as of writing but may change as companies continue to report quarterly earnings.
- The index is not a predictor of investment performance. Retailers with higher financial-health scores are much less likely to file for bankruptcy than retailers with low scores.
Figure 5. Coresight Research Coronavirus Retail Robustness Index: Full List [wpdatatable id=363 table_view=regular]
Note: Figures may fluctuate due to rounding * Tailored Brands for bankruptcy protection subsequent to the writing of this report. Source: Company reports/S&P Capital IQ/Coresight Research
Appendix
Retail Robustness Index Methodology The individual components are discussed further below.- Retailer financial health (40%): Represents a retailer’s financial state and ability to handle financial challenges.
Commentary: Many retailers have subsequently drawn on their credit lines and/or issued debt offerings and reduced expenditures, which bolsters their financial position. One component of this score is the market value of a company’s stock, which affects its ability to raise additional capital.
- Sales capacity (20%): Represents a retailer’s ability to sell products.
Commentary: This score is based on the percentage of each retailer’s stores that are currently open.
- Product mix (20%): Determines the relative benefit of a retailer’s product categories.
Commentary: The score is now calculated from a weighted average based on Coresight Research weekly consumer surveys.
For the Product Mix metric, we leverage insights from Coresight Research’s weekly US consumer surveys. Our new scores are based on a weighted average of product mix, based on the ratio of buying more to buying less (as of July 22) in the categories below.
Base: US Internet users aged 18+ Source: Coresight Research [/caption]
- Management tenure (20%): Reflects the number of years that the CEO has served in the position.
Commentary: CEOs who have occupied their positions for longer should be better acquainted with the company and better equipped to navigate the current environment.