DIpil Das
What’s the Story?
This report presents Coresight Research’s updated Retail Robustness Index (RRI), which evaluates the 100 largest US retailers (by revenue) on their ability to weather the dramatic demand shifts amid the Covid-19 crisis in the US. In this quarterly update, we evaluate retailers based on financial health, sales capacity, product mix and management tenure.Why It Matters
Retailers continue to face a perfect storm of challenges, with increased e-commerce penetration and heightened competition exacerbated by the pandemic and shifts in consumer shopping behaviors. There have been large numbers of store-closure announcements and bankruptcy filings during the past several years, and the Covid-19 outbreak put even greater pressure on retailers. We developed this index as a tool for evaluating retailers’ ability to persevere in the current environment.The Retail Robustness Index: In Detail
In this update, the average score across the full index decreased by 0.5 points to 51.3, owing to decreases in sales capacity and management tenure more than offsetting improvements in financial health and product mix:- Sales capacity—Urban Outfitters reported in early March 2021 that nearly all of its European stores were under lockdown, which was the case for other retailers with Europe exposure.
- Management tenure—The Container Store, CVS Health, Dick’s Sporting Goods, PVH Corp. and Walgreens Boots have reported changes in the CEO position since the beginning of the calendar year.
Figure 1. Retail Robustness Index and Its Components, by Month [caption id="attachment_126111" align="aligncenter" width="725"]
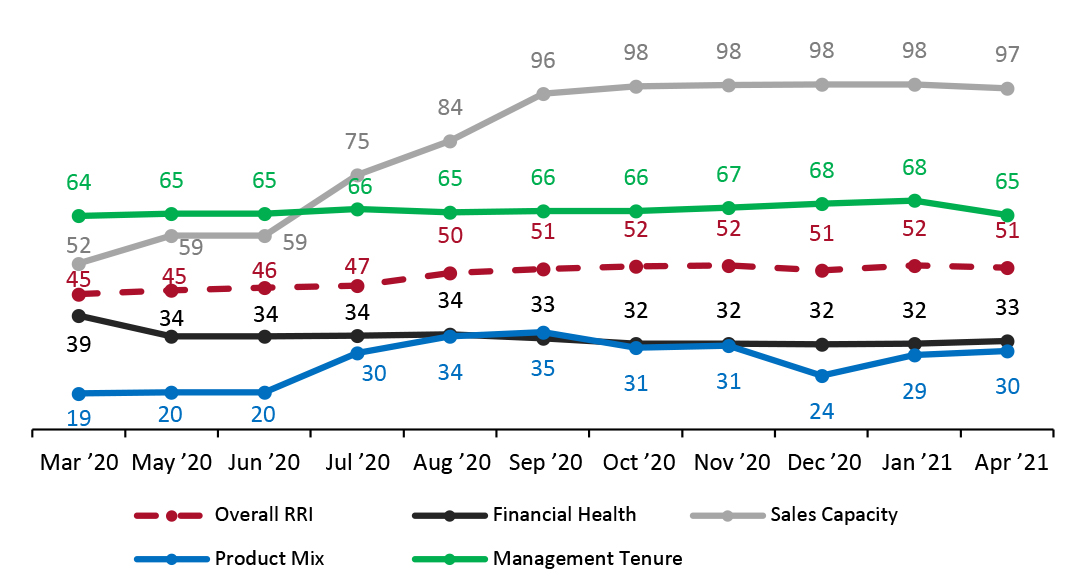 The index includes new weightings and methodologies for sales capacity and product mix starting in July 2020
 Source: Coresight Research [/caption] RRI Outlook RRI scores have largely reached stability, with only marginal volatility from temporary store closures and management changes. Many retailers prudently raised capital at the outset of the outbreak, enabling them to capitalize on the holiday selling season and into 2021. The challenge for retailers, particularly those focusing on apparel, is in how to continue to handle the current environment, with consumers still largely avoiding stores and not requiring clothing for formal occasions or for working in the office. Top 10 Retailers by RRI Ranking Figure 2 presents the 10 retailers that rank highest in our index as of the start of April 2021. For the most part, changes in scores were modest: Staying in the number-one spot, only Chewy saw a significant increase, of 10 points. Nine of the retailers remained the same as our previous update in January, with new entrant Pool Corp. knocking Steve Madden out of the top 10.
Figure 2. Changes in Retail Robustness Index: Top 10 Retailers [wpdatatable id=883 table_view=regular]
Score changes are rounded from the metric calculations, rather than derived from the absolute score numbers shown in the table Source: Coresight Research Commentary on Score Changes As highlighted above, the slight decline in the RRI overall was driven by management changes plus a slight downtick in sales capacity caused by renewed store closures, which was somewhat offset by improvements in financial health and product mix. We also saw a decrease in the ratio of consumers buying more food or nonalcoholic beverages than they did before the Covid-19 outbreak to those buying less, which makes the other categories rank slightly more positively. Compared to the January 2021 index, 59 of the 100 companies received higher scores, 17 scores remained flat, 23 companies experienced score declines and one company was replaced (Tiffany). All of the companies experiencing large score changes were due to CEO changes, which is a major factor in our methodology. We outline the five largest score changes below:
- PVH Corp. (decrease of 20 points). The total score decreased primarily due to a decrease in the management-tenure score plus small decreases in financial health and sales capacity.
- CVS Health (decrease of 19 points). The total score decreased primarily due to a decrease in the management-tenure score. Most other scores were flat.
- Dick’s Sporting Goods (decrease of 19 points). The total score decreased primarily due to a decrease in the management-tenure score. Most other scores were flat.
- Walgreens Boots (decrease of 18 points). The total score decreased primarily due to a decrease in the management-tenure score. Most other scores were flat.
- Container Store (decrease of 13 points). The total score decreased primarily due to a decrease in the management-tenure score. Financial health and product-mix scores also declined slightly.
Figure 3. Retail Robustness Index, by Segment [caption id="attachment_126095" align="aligncenter" width="725"]
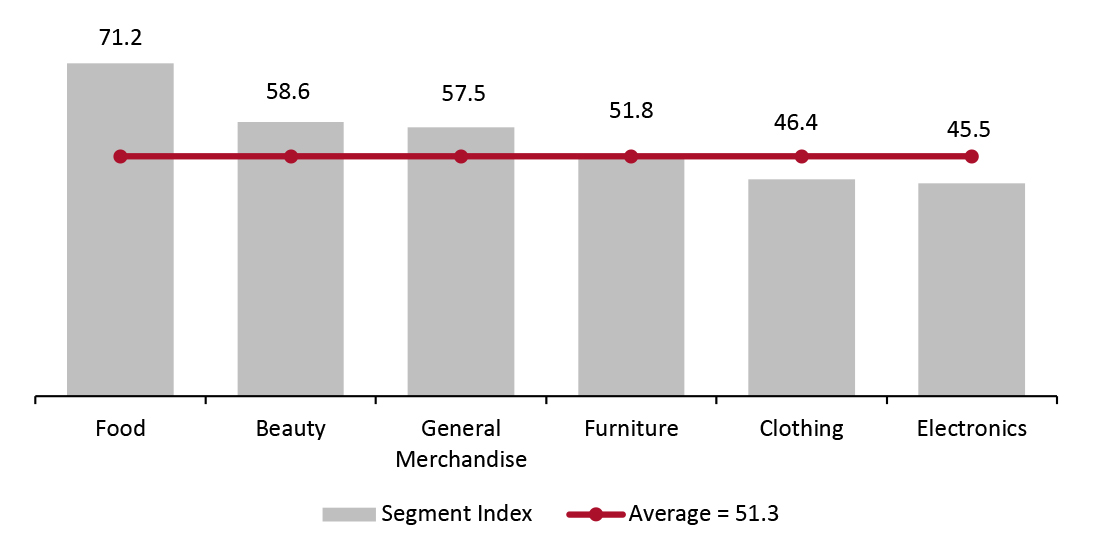 Source: Coresight Research[/caption]
- Food ranks the highest due to its high product mix and availability since it remains an essential category, though its relative outperformance has declined year to date as consumers shift purchases toward restaurants and away from grocery.
- Beauty continues to rank above average, owing to the robustness of companies in that category, despite a greater proportion of respondents in our US Consumer Tracker continuing to say that, compared to pre-pandemic, they are currently buying less in the beauty, cosmetics and fragrances category than those stating they are buying more.
- Clothing and electronics rank below average due to consumers currently purchasing less in these product categories compared to before the pandemic, although the percentage of consumers purchasing more of each category has increased year to date.
Figure 4. Coresight Research Retail Robustness Index: Full List [wpdatatable id=884 table_view=regular]
Figures may fluctuate due to rounding—score changes are rounded from the metric calculations, rather than derived from the absolute score numbers shown in the table; Green represents an increase from the previous update, while red represents a decrease. Source: Company reports/S&P Capital IQ/Coresight Research
Appendix
Analysis Methodology The Coresight Research RRI evaluates the 100 largest US retailers (by revenue) based on their ability to weather the current shifts in demand due to the coronavirus crisis. Appendix Figure 1 outlines the components and weighting of the index.Appendix Figure 1. Coresight Research Retail Robustness Index: Components and Weighting [wpdatatable id=885 table_view=regular]
Source: Coresight Research Additional notes on the Coresight Research RRI:
- The index is a model for retail robustness based on selected weights and factors and relies on certain assumptions and estimates.
- The environment is evolving dramatically at a fast pace: Figures are thought to be accurate as of writing but may change as companies continue to report quarterly earnings.
- The index is not a predictor of investment performance. Retailers with higher financial-health scores are much less likely to file for bankruptcy than retailers with low scores.
• Retailer financial health (40%): Represents a retailer’s financial state and ability to handle financial challenges.
Commentary: Many retailers have drawn on their credit lines and/or issued debt offerings and reduced expenditures, which bolsters their financial position. One component of this score is the market value of a company’s stock, which affects its ability to raise additional capital.
• Sales capacity (20%): Represents a retailer’s ability to sell products.
Commentary: This score is based on the percentage of each retailer’s stores that are currently open.
• Product mix (20%): Determines the relative benefit of a retailer’s product categories.
Commentary: The score is calculated from a weighted average based on Coresight Research weekly consumer surveys.
• Management tenure (20%): Reflects the number of years that the CEO has served in the position.
Commentary: CEOs who have occupied their positions for longer should be better acquainted with the company and better equipped to navigate the current environment.
Appendix Figure 2 below shows the ratio of “buying more” to “buying less” for selected categories.Appendix Figure 2. Ratio of “Buying More” to “Buying Less” for Selected Categories [wpdatatable id=886 table_view=regular]
April data from Coresight Research’s US Consumer Tracker dated March 29, 2021 Source: Coresight Research