
DIpil Das
Amazon Prime Day Discount Overview
Amazon Prime Day 2019 began in the US at midnight Pacific Time on July 15. This year, the event ran 48 hours, up from last year’s 36 hours, making it the longest Prime Day sale so far. Amazon had deals in more than 14 categories, from home improvement to baby products.
In collaboration with competitive intelligence provider DataWeave, we aggregated data on prices in four categories on Amazon’s US site: electronics, health and beauty, men’s fashion and women’s fashion. In this report, we analyze the scale and distribution of price cuts on Amazon.com on Prime Day, and we provide some brief comparisons to Walmart and Target price cuts during the event. We used each product’s price on July 8 as the pre-Prime-Day base and analyzed price differences on July 15 and 16.
Overall, women’s fashion offered the highest average discount on both days and electronics the lowest. Men’s fashion had the highest percentage of goods on sale and the highest percentage of products that continued to lower prices from the first day.
As we show below, men’s fashion and women’s fashion had average double-digit percentage discounts across the Prime Day event, with women’s fashion seeing price cuts on tracked products as high as 87%. Electronics saw an average mid-single-digit percentage reduction in prices.
[caption id="attachment_94170" align="aligncenter" width="700"]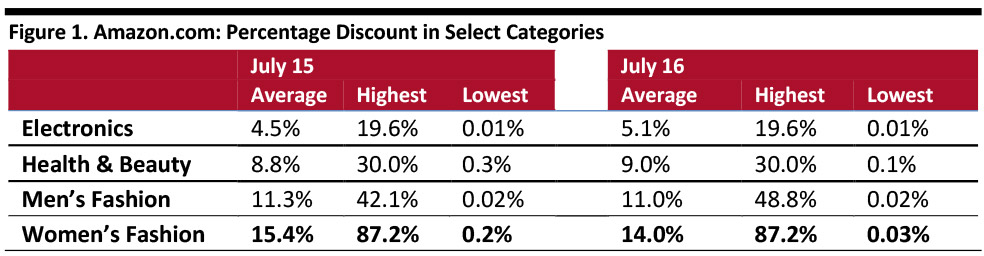 Source: DataWeave/Coresight Research[/caption]
The proportion of tracked products discounted in price across the two days ranged from the mid-teens in women’s fashion to around 30% in men’s fashion. As we discuss later, however, some tracked products saw price increases during the event — though these increases were typically less common than price reductions.
[caption id="attachment_94171" align="aligncenter" width="700"]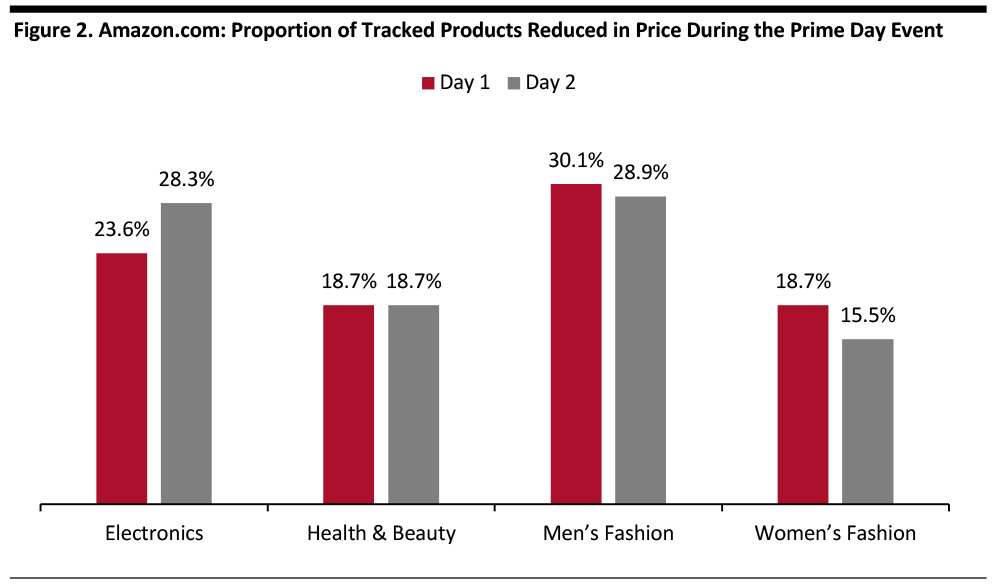 Source: DataWeave/Coresight Research[/caption]
Electronics
We analyzed the prices of 106 products, selected from top-featured goods across different electronics subcategories.
On the first day, 23.6% of products were offered at lower prices, but 13.2% were offered at higher prices than on July 8. The discounts ranged from 0.01% to 19.6%, with an average of 4.5%. None of the discounted products continued to decrease prices on day two.
On day two, 28.3% of products were offered at lower prices but 14.2% were offered at higher prices than on July 8. The average discount was 5.1%, with a range from 0.01% to 19.6%.
Between July 15 and 16, only 3.8% of products had a price difference that was greater than one dollar.
Health & Beauty
We analyzed the prices of 134 products, selected from top-featured goods across different health and beauty subcategories.
On the first day, 18.7% of products were offered at lower prices, but 14.9% at higher prices than July 8. The discounts ranged from 0.31% to 30.0%, with an average of 8.8%. Only 2.2% of discounted products continued to decrease prices on day two.
On the second day, 18.7% of products were offered at lower prices but 19.4% were higher than on July 8. The discounts ranged from 0.1% to 30.0%, with an average of 9.0%.
Over the two days, just 8.2% of products had a price difference greater than one dollar.
Men’s Fashion
We analyzed the prices of 166 products, selected from top-featured goods across different men’s fashion subcategories.
On the first day, 30.1% of products were offered at lower prices and 17.5% at higher prices than on July 8. The discounts ranged from 0.02% to 42.1%, with an average of 11.3%. Some 7.8% continued to cut prices, while 9.6% raised prices on day two.
On the second day, 28.9% of products were offered at lower prices than on July 8, while 24.1% were higher. The discounts ranged from 0.02% to 48.8%, with an average of 11.0%.
Over the two days, 27.1% of products had a price difference greater than one dollar.
Women’s Fashion
We analyzed the price of 155 products, selected from top-featured goods across different women’s fashion subcategories.
On the first day, 18.7% of products were offered at lower prices while 13.5% were higher than on July 8. The discounts ranged from 0.2% to 87.2%, with an average of 15.4%. Only two products continued to decrease price, while 4.5% increased price on day two.
On the second day, 15.5% of products were offered at lower prices while 12.9% were higher than on July 8. The discounts ranged from 0.03% to 87.2%, with an average of 14.0%.
Over the two days, only 8.4% of products had a price difference greater than one dollar.
Prime Day Sales Estimates: Over $5 Billion
Amazon does not disclose figures for sales generated during Prime Day. Based on information disclosed by Amazon following Prime Day, we provisionally estimate the event generated global sales in the region of $5.3 billion this year, up by slightly more than one-third from our $3.9 billion for 2018. This estimated 2019 total suggests Amazon under-shot our pre-Prime Day estimate that it would generate global sales of around $5.8 billion on Prime Day 2019, up by around one-half year over year.
This growth was in the context of a bigger event, with more promotions and initiatives over a longer period: Prime Day 2018 was 36 hours, 2019 was 25% longer at 48 hours.
Our figures reflect estimated product sales online (gross merchandise volume) and exclude revenues from additional Prime membership sign-ups during Prime Day.
Other Retailers’ Activities
Just as last year, other US retailers jumped on the Prime Day bandwagon, offering their own promotions to coincide with the event. We collated data on online price reductions by Target and Walmart, as well as Amazon.
In men’s and women’s fashion, Target offered an average of 26.5% in additional discounts, while Walmart offered 16.6% off, according to DataWeave. In addition, 6.7% of Target’s fashion category products were on sale, versus Walmart’s 3.8%.
About DataWeave
Powered by proprietary AI, DataWeave provides competitive-intelligence-as-a-service to e-commerce businesses and consumer brands by aggregating and analyzing data from the web. While e-commerce businesses use DataWeave’s Retail Intelligence product to make smarter pricing and merchandising decisions and drive profitable growth, consumer brands use DataWeave’s Brand Analytics product to protect their brand equity online and optimize the experience delivered to shoppers on e-commerce websites. For more information, visit its website.