DIpil Das
What’s the Story?
Inflation has been a challenge for both retailers and consumers throughout 2021. Rising prices are the result of supply-demand mismatches caused by the pandemic and global supply chain bottlenecks. In this report, we review inflation in three major retail sectors: food at home, apparel and furniture. We discuss the causes of inflation and analyze price increases for key inputs in each sector as we head into the holiday season.Why It Matters
Inflation is a concern for retailers and consumers. In our most recent check on holiday expectations, over 40% of US holiday spenders indicated that they are concerned about inflation. Rising prices are putting margin pressures on retailers, which may be forced to raise (or further raise) their selling prices.Price Jumps and Input Cost Increases: Coresight Research Analysis
We examine input costs and their effect on consumer prices across the following three sectors: food at home, apparel and furniture retail. Food at Home According to the US Department of Agriculture, close to 90% of US consumer food spending is on domestically produced food: US food at home is therefore less vulnerable to global supply chain bottlenecks and port closures. Nevertheless, prices in the US for food at home have risen rapidly since the start of the summer. Because of the extent of domestic production, the producer price index (PPI) is the best benchmark of output costs in the food industry. In the chart below, we compare those costs with the price rises experienced by consumers.- The consumer price index (CPI) has recently tracked below the PPI, suggesting margin compression in the food retail supply chain due to the added costs in food production.
- The recent under-indexing of CPI versus PPI comes despite inflation seen in some post-production supply chain costs, including rising labor and distribution costs in retail.
- Since its 2021 low in May, when it was annualizing the spike of May 2020, the PPI has jumped by 11 percentage points. Although we see little time lag between the PPI and CPI in the trend data, the strength and general upward trajectory of the PPI suggest that we will see a rise in the CPI in the coming months.
Figure 1. US Food-at-Home: Producer Price Index vs. Consumer Price Index (YoY % Change) [caption id="attachment_136101" align="aligncenter" width="724"]
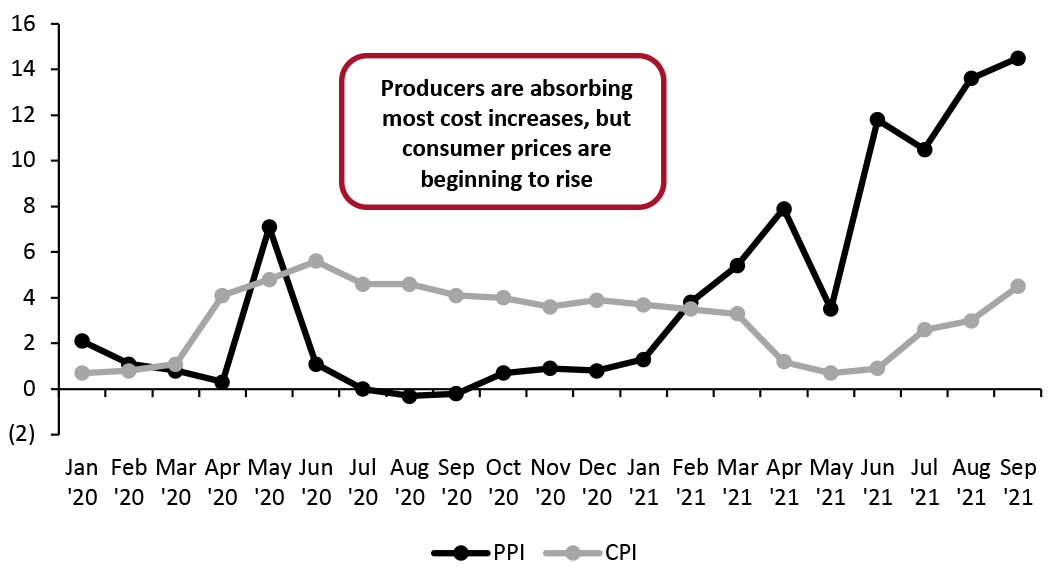 Data are not seasonally adjusted
 Source: Bureau of Labor Statistics [/caption] The narrative around rising food prices centers around meat. According to the Bureau of Labor Statistics, meat prices have exhibited year-over-year growth of over 25% in each month of 2021. According to the latest data, September saw the second-largest year-over-year growth in meat prices, at 38.1%. Rising meat prices are the result of a supply-demand mismatch—a consequence of the Covid-19 pandemic. Last year, the pandemic forced meat producers to slow their operations due to high infection rates among workers and decreased demand; prices fell, as depicted in Figure 1. Demand rapidly increased in summer 2021 as consumers returned to restaurants. Currently, meat operators cannot meet increased demand as they struggle to find enough workers amid a tight labor market. On Costco’s September 23, 2021, earnings call, Richard Galanti, CFO of the company, said, “Inflation is up in the mid- to high-single digits, with meats leading the way.” Management expects inflation of overall products to be 3.5%–4.5%, as rising meat prices play a large role in their selling prices.
Figure 2. US Processed Meat: Producer Price Index (YoY % Change) [caption id="attachment_136087" align="aligncenter" width="725"]
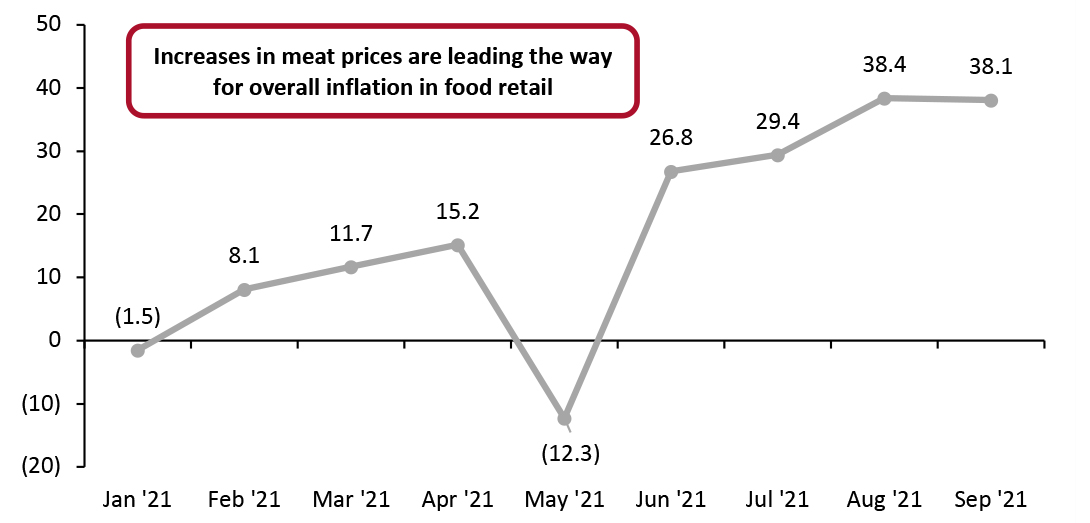 Data are not seasonally adjusted
 Source: Bureau of Labor Statistics [/caption] Overall, changes in the CPI appear to mirror the changes in the PPI for food at home. As supply-side prices of meat continue to rise, so will prices of food at home. Apparel The majority of apparel products sold in the US are imported from China and Vietnam. For this sector, import prices are therefore a more relevant metric than the PPI.
- Import prices have remained stagnant since the beginning of 2020, which is surprising given ongoing supply chain challenges.
- Conversely, consumer prices have been high throughout 2021, peaking in May. Strong demand from consumers has coincided with constrained supply as a result of supply chain challenges. With such high demand, retailers will have little incentive to offer discounts and that dialing down of promotions equates to indirect inflation in consumer prices: Since May’s peak, year-over-year price inflation has been slowing but remains high.
Figure 3. US Apparel: Import Prices vs. Consumer Price Index (YoY % Change) [caption id="attachment_136088" align="aligncenter" width="726"]
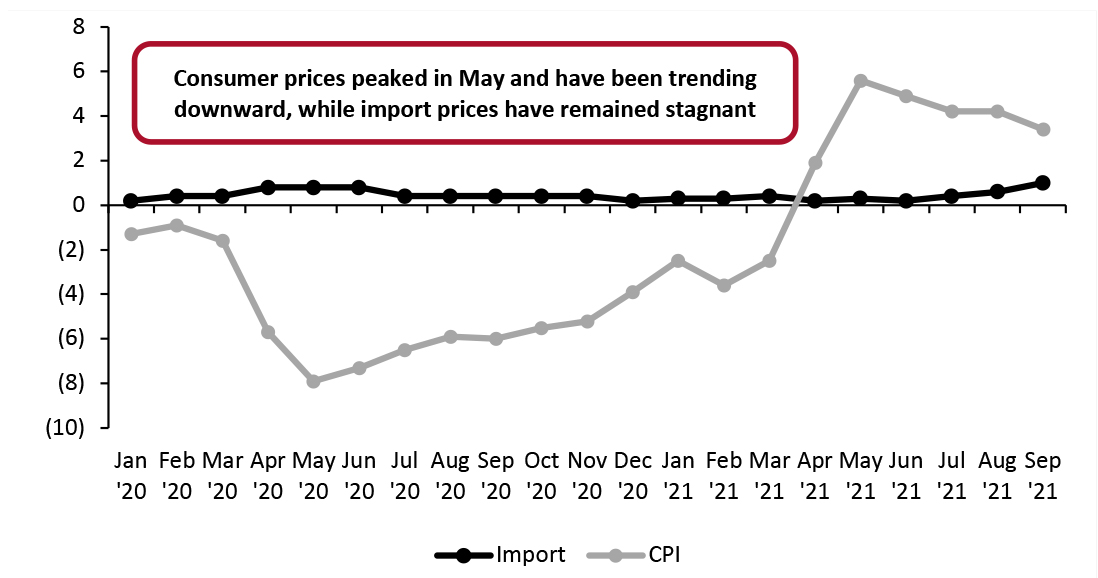 Data are not seasonally adjusted
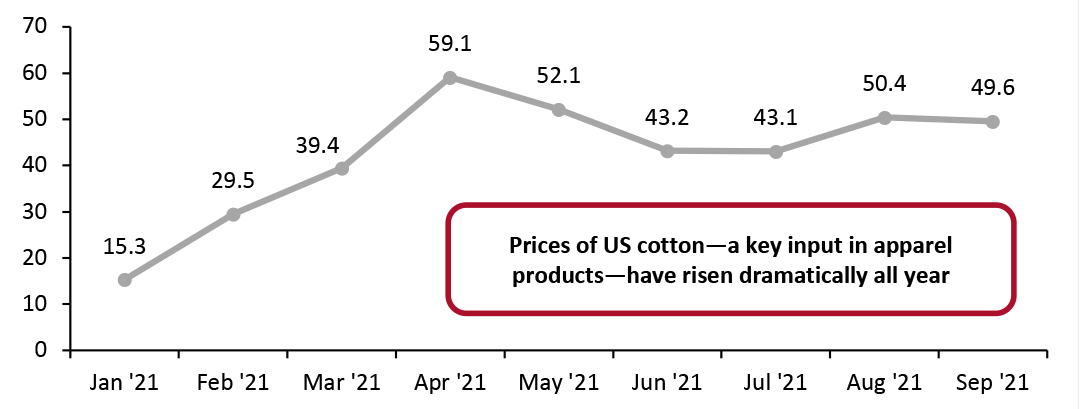
 Source: Bureau of Labor Statistics [/caption] Consumer spending on apparel was curtailed for much of 2020; retailers consequently reduced production and laid off workers. Clothing sales skyrocketed in the summer of 2021, as pent-up demand was released and consumers returned to socializing and visiting public places. Supply chain issues in Vietnam and China have posed severe challenges for retailers this summer. Vietnam, the second-largest exporter of apparel products to the US, has seen lengthy lockdowns in 2021, including a three-month shutdown of its capital, Ho Chi Minh City. Likewise, in China, the Yantian and Ningbo-Zhoushan ports—two of the four busiest ports in the world—were shut down as a result of Covid-19 outbreaks. The Yantian port shutdown in June lasted three weeks and the Ningbo-Zhoushan port closure in August lasted two weeks. Despite importing most of its finished apparel products, the US is the world’s second-largest exporter of cotton, behind China. According to the US Department of Agriculture, Vietnam and China are the top two export markets for US cotton, the majority of which is produced in the state of Texas. Severe weather in Texas this past winter resulted in a reduced supply of cotton in 2021, putting upward cost pressures on textile manufacturers. In late August, Hurricane Ida caused an estimated $25 billion dollars’ worth of damage in Louisiana, a state that hosts three of the country’s top 10 ports by tonnage, further complicating an already complex supply chain picture.
- For more on this topic, read our separate report: Supply Chain Briefing: Hurricanes, Lockdowns and Shutdowns Hit Supply of Goods, Compounded by Component Shortages
Figure 4. US Cotton Export: Price Growth (YoY %) [caption id="attachment_136089" align="aligncenter" width="725"]
 Data are not seasonally adjusted
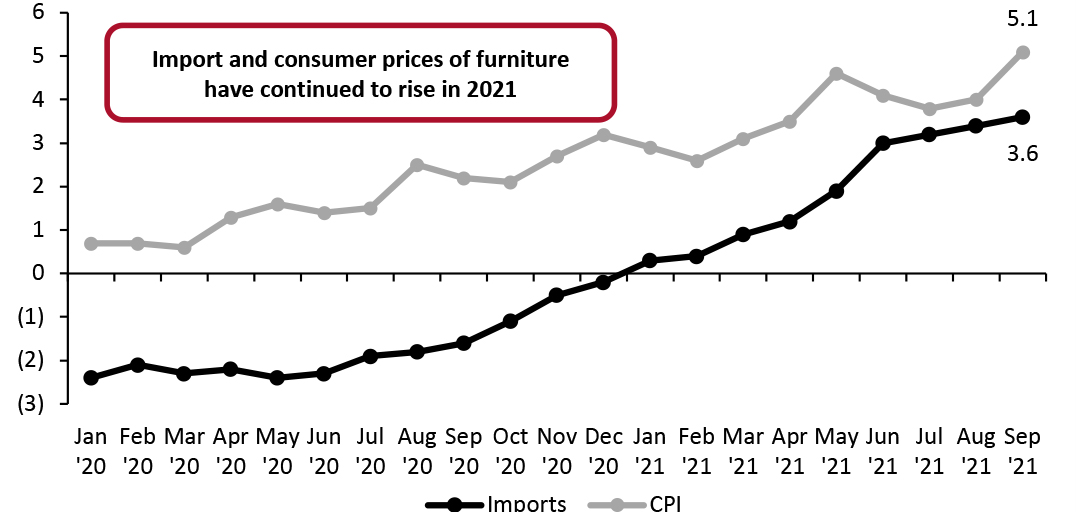
 Source: Bureau of Labor Statistics [/caption] Currently, high consumer demand for apparel products combined with a constrained supply is keeping consumer prices high, although they are trending downward. The price of cotton—a key apparel input—has faced upward pressure as a result of constrained supply. Furniture The bulk of US furniture is imported, with China and Vietnam again the top countries of origin. For this sector, then, import prices are a more relevant metric of retailers’ input prices (as PPI reflects domestic production).
- In 2020 and 2021 year to date, the CPI grew faster than input prices, fueled by strong demand from housebound shoppers. Input price inflation crept up steadily over 2020 as pandemic-impacted supply chains raced to meet strong consumer demand. The relative trends suggest that the majority (at least) of overall industry cost increases are being recovered.
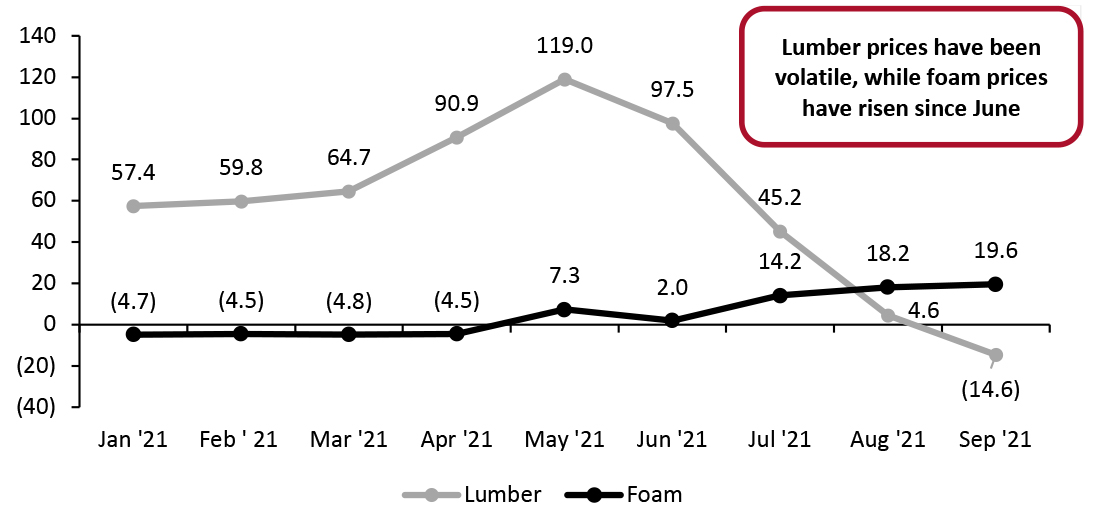
- In 2021, price rises of inputs such as lumber and foam have outpaced consumer price rises—a pattern that we have also observed with food (above). In both cases, this implies selective margin attrition—as retailers or intermediaries are failing to recoup the full rises in these specific input costs. Volatility in lumber prices has led the price of this input to under-index the CPI in the most recent month for which data are available, September.
Figure 5. US Furniture: Import Prices vs. Consumer Price Index (YoY % Change) [caption id="attachment_136090" align="aligncenter" width="725"]
 Data are not seasonally adjusted
 Source: Bureau of Labor Statistics [/caption] According to a study published by US online real estate marketplace Zillow in April 2021, more than one in 10 Americans moved homes during the pandemic. For those who moved by choice, their new homes were on average 33 square feet larger than their previous homes; new, larger homes increased demand for new furniture. Stay-at-home orders also sparked consumer interest in home improvement, boosting demand for furniture even further. Besides this increase in demand, the costs of inputs such as lumber and foam are putting additional upward pressure on consumer prices. Lumber prices have been exceptionally volatile in 2021. As recently as May, lumber prices posted 50.6% year-over-year growth, but in September, prices grew by just 2.5% year over year. (Volatile lumber prices have been the result of rapid demand shocks, and we could see a correction in the coming months.) Increases in lumber prices have put margin pressures on retailers such as Home Depot: On the company’s August 17, 2021, earnings call, CFO Richard McPhail noted a decrease of 80 basis points on Home Depot’s gross margin, 60 points of which he attributed to volatile lumber prices.
Figure 6: US Lumber vs. Foam Prices (YoY % Change) [caption id="attachment_136091" align="aligncenter" width="726"]
 Data are not seasonally adjusted
 Source: Bureau of Labor Statistics [/caption] Meanwhile, the cost of foam has also jumped. Polyurethane foam is the most common cushioning material used in furniture and is found in most furniture sold to US customers. However, Winter Storm Uri hit the US in February, shutting down foam production plants and causing double-digit year-over-year price increases.