
Nitheesh NH
What’s the Story?
The Coresight Research Playbook series provides recommendations for brands, retailers and marketplaces seeking to tap growth segments and emerging trends. In our Retail 2021: Global Trends report, we discuss how retail this year will be defined by a mixture of sticky pandemic-driven changes in behavior and reversions to pre-crisis behaviors. In this Playbook, we present strategies and actions that US retailers can take to best capitalize on key trends in consumer behavior.Why It Matters
We have extensively covered changes in consumer behavior throughout the pandemic through our US Consumer Tracker and other reports. Now, as vaccines are being rolled out and the end of the crisis could be in sight, retailers must understand which pandemic-driven behaviors will revert and which may continue to reshape the retail landscape. According to our US Consumer Tracker, consumers have been split almost 50-50 in terms of whether they plan to retain pandemic-driven changed behaviors following the crisis. A combination of sticky and reverted behaviors will impact retail moving forward, driving the need for US retailers to adapt to changes in consumer spending habits and lifestyles in order to be successful in the complex retail environment in 2021 and beyond. Figure 1. US Consumers’ Expectations To Behave Differently/Retain Changed Way of Living in the Long Term (% of Respondents) [caption id="attachment_125344" align="aligncenter" width="710"]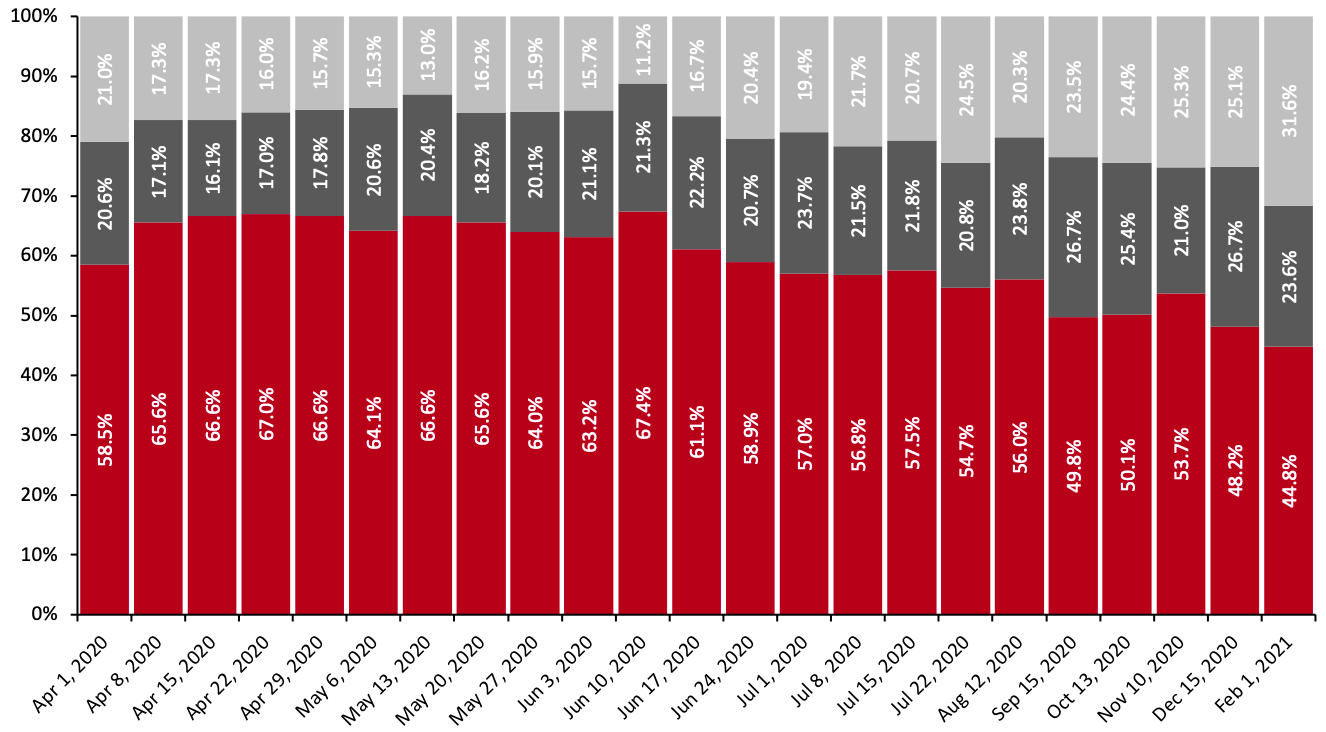 Question not asked every week
Base: US respondents aged 18+
Source: Coresight Research[/caption]
New Ways of Living and Spending in the US: A Playbook
We identify five key trends in US consumer spending and living habits that are driving shifts in the retail landscape and discuss how retailers can adjust their strategies to cater to recent changes in behavior. We summarize these trends and strategies in Figure 2. Figure 2. Five Key Strategies for Retailers To Adapt to Trends in Consumer Behavior [caption id="attachment_125345" align="aligncenter" width="710"]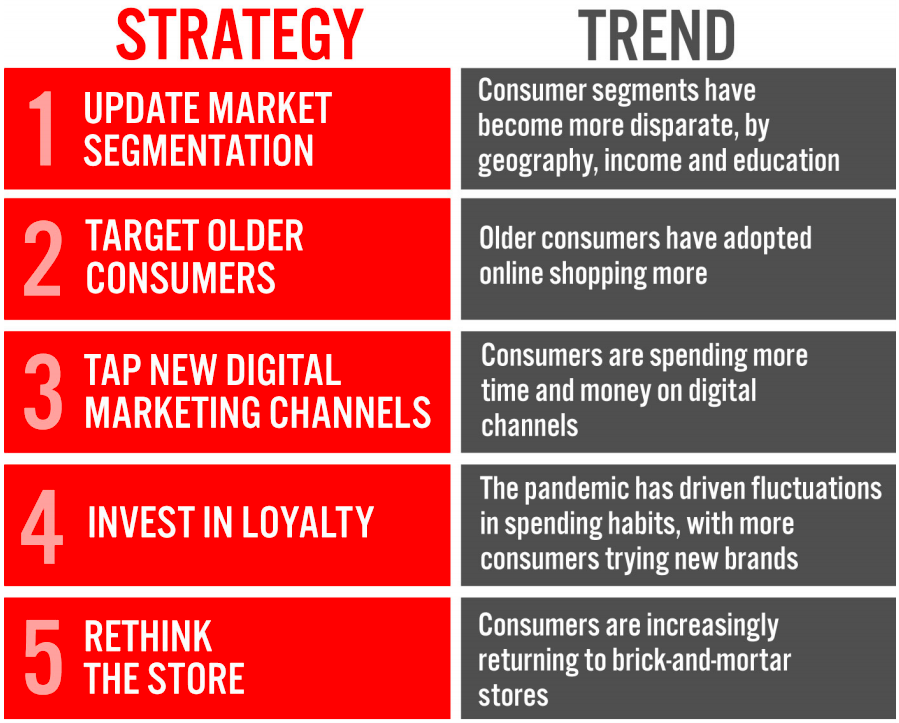 Source: Coresight Research[/caption]
1. Update Market Segmentation
Trend: The pandemic has widened the gulfs between different consumer segments by geography, income and education. -------- Strategy: Retailers must abandon old, static targeting models in favor of more agile approaches that can make speedy and drastic changes in segmentation to appeal to increasingly disparate groups of consumers.
The new ways of living and spending that consumers have adopted due to the pandemic are not uniform across the demographic spectrum. Retailers therefore need to understand whose behaviors have shifted and whose habits have remained relatively stable. One of the most impactful changes in behavior has been in how and where people work. According to a recent survey by the US Census Bureau, 36% of US households had at least one adult substitute some or all of their typical in-person work for telework because of the coronavirus pandemic. The new homebody consumer is likely here to stay—in some demographic groups. In the US, there is a strong correlation between a shift to working from home and education level, and consumers’ propensity to work from home has not been reduced recently even as virus cases decrease (see Figure 3). Figure 3. Education Level of US Adults That Substituted Some or All of Their Typical In-Person Work for Telework Because of the Coronavirus Pandemic (% of Households) [caption id="attachment_125362" align="aligncenter" width="710"]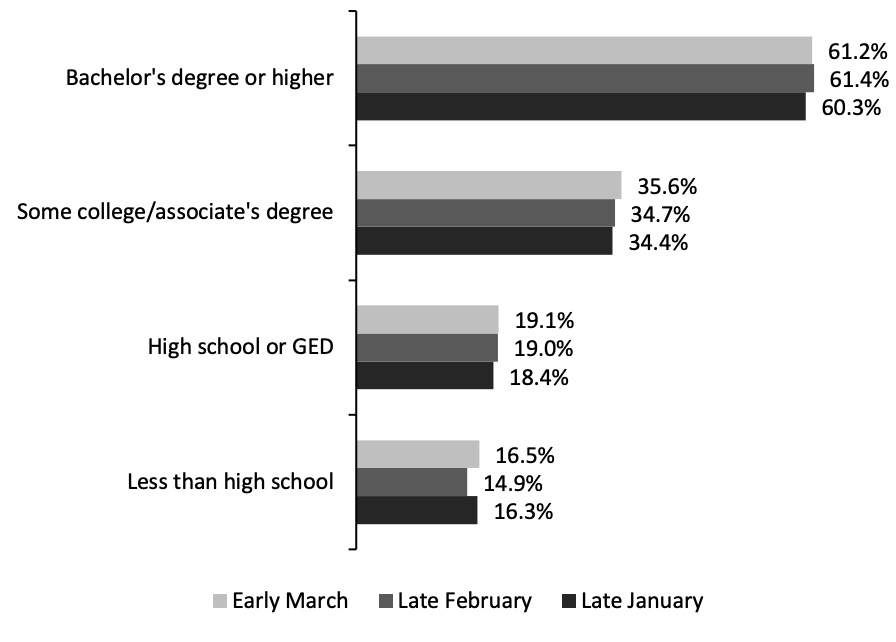 Source: US Census Bureau[/caption]
In all three survey iterations, individuals with bachelor’s degrees or higher were more than three times as likely to be working from home at least part time due to the pandemic than their peers with a high school education or less.
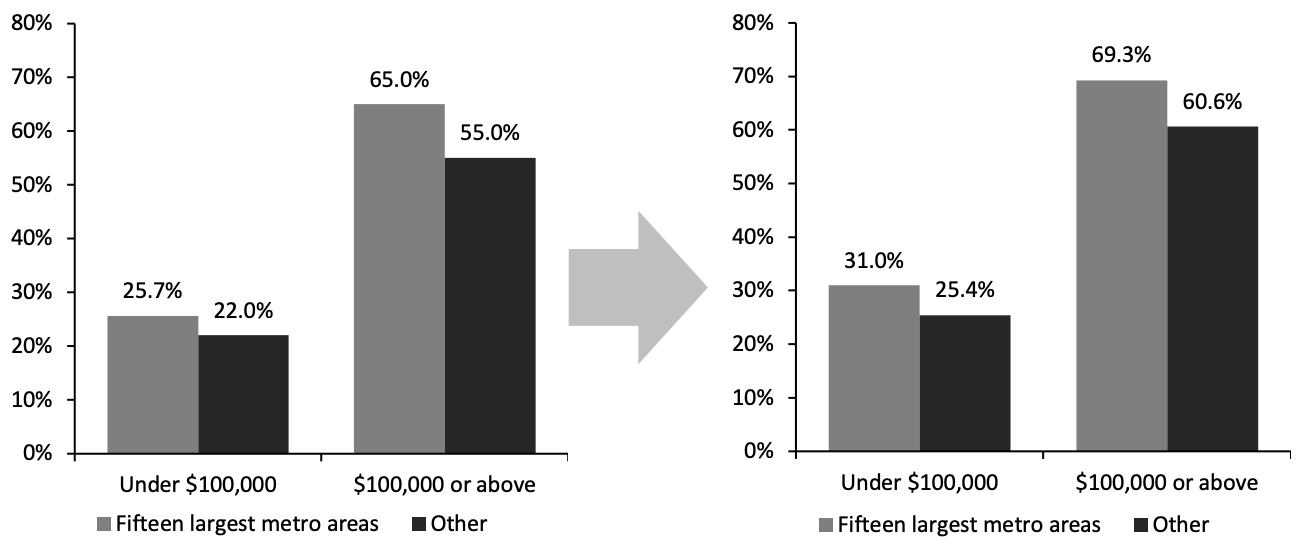
Similar discrepancies play out along income boundaries (see Figure 4), and consumers are still working from home even as vaccination efforts gain steam. Beyond the expected bifurcation of work status based on income, consumers in large metro areas are also significantly more likely to have the opportunity to work from home. The distinction between large urban areas and other regions of the country grows clearest in high-income consumers: A roughly 10-percentage-point gap in ability to work from home appears in consumers earning over $100,000 in large metro areas versus those elsewhere in both survey iterations. That is the equivalent of an extra 4.4 million consumers working from home in these major metro areas than would be if those urban areas followed the same work patterns as the rest of the country.
Figure 4. US Households with Adults That Substituted Some or All of Their Typical In-Person Work for Telework Because of the Coronavirus Pandemic, Late January 2021 (Left) vs. Early March 2021 (Right) (% of Households)
[caption id="attachment_125363" align="aligncenter" width="710"]
 Source: US Census Bureau/Coresight Research[/caption]
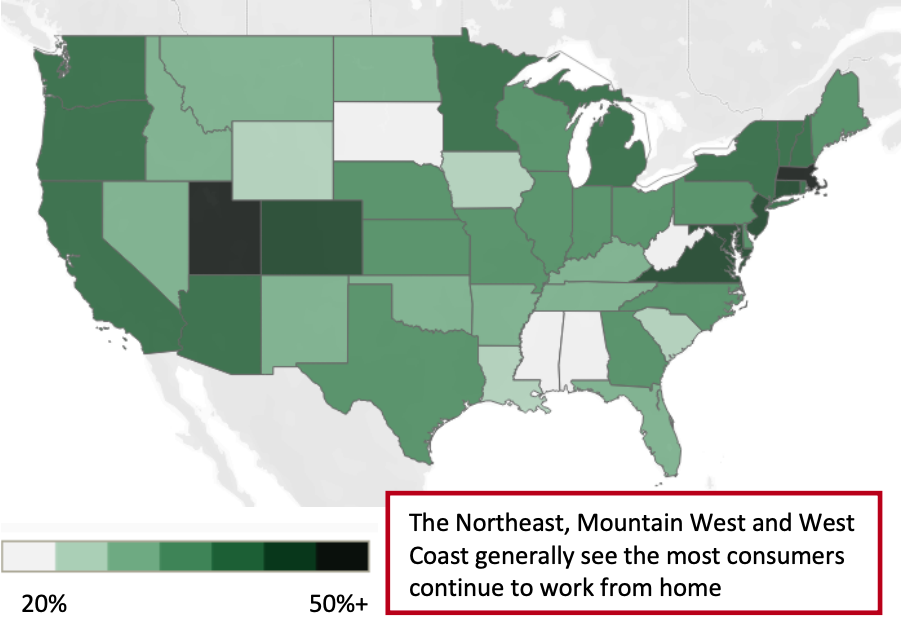
Regional differences have also manifested themselves: The Northeast and West Coast have seen the most consumers switch to working from home—perhaps unsurprisingly, given that virus-related restrictions have been strongest in these areas. These state-by-state variations in working from home are illustrated in the figure below.
Figure 5. US Households Reporting At Least One Member Working from Home At Least Part Time as a Result of the Pandemic, by Geography, as of Late February 2021 (% of Households)
[caption id="attachment_125364" align="aligncenter" width="720"]
 Source: US Census Bureau/Coresight Research[/caption]
While it has always been important for retailers to segment their consumer base by demographic factors, the pandemic has further widened the differences in behaviors. Retailers can succeed by tailoring their offline approaches to different consumers in different areas. Consumers in wealthy areas are likely to trade up to higher-priced products, while consumers hit hard by the pandemic in lower-income areas are likely to seek affordable options. In major urban areas, retailers can also expect to see sustained demand for home goods as consumers continue to work remotely; in other areas, retailers will do well to revert to certain pre-crisis strategies, as more consumers return to the workplace and spend more time outside of the household.
Online, retailers must leverage consumer data to ensure they can create agile, targeted online experiences. As the US consumer base grows increasing disparate and behaviors change more rapidly, static targeting models will be less effective.
2. Target Older Consumers
Trend: Older consumers have moved their shopping and socializing online during the pandemic and are likely to continue to use digital channels post crisis. --------- Strategy: Retailers must adjust online offerings previously tailored to younger consumers to also appeal to older generations with different digital preferences.
While older consumers are often thought of as reluctant to switch spending online, health concerns around the pandemic have changed many older consumers’ attitudes to e-commerce. Older consumers now appear willing to spend online on categories that are traditionally purchased mostly in brick-and-mortar stores, such as grocery. In Coresight Research’s March 1 consumer survey, nearly the same proportion of respondents over the age of 60 reported purchasing groceries online in the prior two weeks as in the 18–29 age group (see Figure 6). Figure 6. US Consumers That Purchased Food or Beverages Online in the Two Weeks Prior to March 1, 2021 (% of Respondents in Each Age Group) [caption id="attachment_125365" align="aligncenter" width="710"]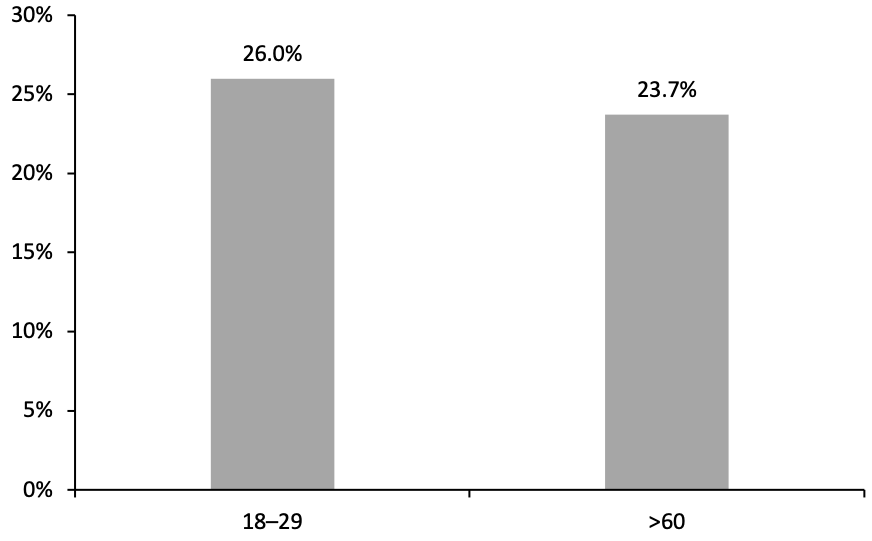 Source: Coresight Research[/caption]
According to a study published in 2009 in the European Journal of Social Psychology, it takes just 66 days, on average, for an individual to form a new habit—indicating that pandemic-driven changes in shopping behavior may be embedded for the long term, particularly around habit-based shopping for routinely purchased items such as groceries. Findings from our US Consumer Tracker support this: Our February 1, 2021 survey found that 48.1% of consumers over the age of 60 plan to continue shopping more online across any category after the end of the pandemic, likely because, as a result of shopping digitally out of necessity amid the crisis, they have realized the benefits of convenience that e-commerce provides.
Many retailers typically focus on consumers between the ages of 25-45—those who have built up enough spending power to prove immediately valuable, but also have greater lifetime potential value to retailers. This approach may be ill suited for a world in which baby boomers are a growing segment of the population and have a greater propensity to spend than their younger peers.
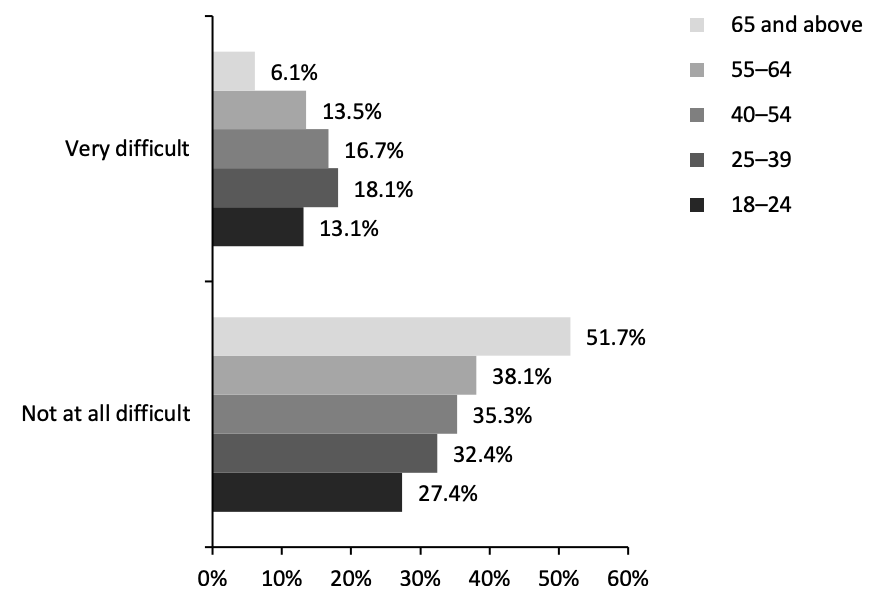
Between 2010 and 2019, consumers aged 60–74 were the fastest growing segment of the population in the US, according to data from the Census Bureau. Each individual member of this growing segment may also be more valuable in the short term than their younger counterparts: Consumers over the age of 65 are by far the least likely to experience any difficulty paying household expenditures in the wake of the pandemic, according to survey findings from the US Census Bureau (see Figure 7).
Figure 7. US Consumers: Whether They Found It Difficult To Pay Household Expenses in the Past Seven Days (% of Respondents)
[caption id="attachment_125366" align="aligncenter" width="710"]
 Base: US consumers surveyed between February 17 and March 1, 2021
Source: US Census Bureau[/caption] Between their growth as a proportion of the population and their greater financial stability, senior consumers have become a vital demographic for retailers. While consumers in general are shopping more through social channels and on mobile devices in recent times, older generations tend to use desktops more frequently and are less likely to make purchases over social media. Pew Research data from 2019 shows that just 53% of US consumers over the age of 65 owned a smartphone compared to the overall ownership rate of 81%. In addition, a recent survey of US consumers conducted by Coresight Research found that just 11% of consumers over the age of 60 report using social media to shop. Ensuring a frictionless, easy-to-use purchase flow on desktop-optimized e-commerce channels will therefore be key for retailers to reach older consumers that are new to online shopping. Simple steps that retailers can take to cater to senior shoppers online can be as simple as using larger fonts on their websites (or having the option to increase font size). Customer support, particularly over the phone, is also an important way that retailers can improve the online shopping experience. Noting the surge in senior online shoppers, grocery delivery company Instacart introduced a senior citizen phone hotline for online shopping assistance in October 2020. The announcement came as the company reported that it gained more than 60,000 senior customers in the month of September 2020. Retailers would do well to take advantage of similar opportunities to better engage with seniors on their own terms. 3. Tap New Digital Marketing Channels
Trend: Consumers are spending more time and money online via an expanding array of platforms. --------- Strategy: Retailers must leverage data-driven approaches to understand where their customers live online and target different online arenas with customized marketing and commerce strategies.
Consumers of all backgrounds are now spending time on a wide variety of streaming and social channels, making it important for retailers to identify where their target consumer base spends their time, in order to optimize their marketing spend. Few platforms illustrate the increased time consumers are spending on digital media better than Twitch, the online streaming service owned by Amazon. Since January 2020, both the total number of hours watched on Twitch and the average number of concurrent viewers on the site have more than doubled, as shown in the figure below. Figure 8. Twitch Average Concurrent Viewers (Left Axis, Mil.) and Total Hours Watched (Right Axis, Mil.) [caption id="attachment_125456" align="aligncenter" width="725"]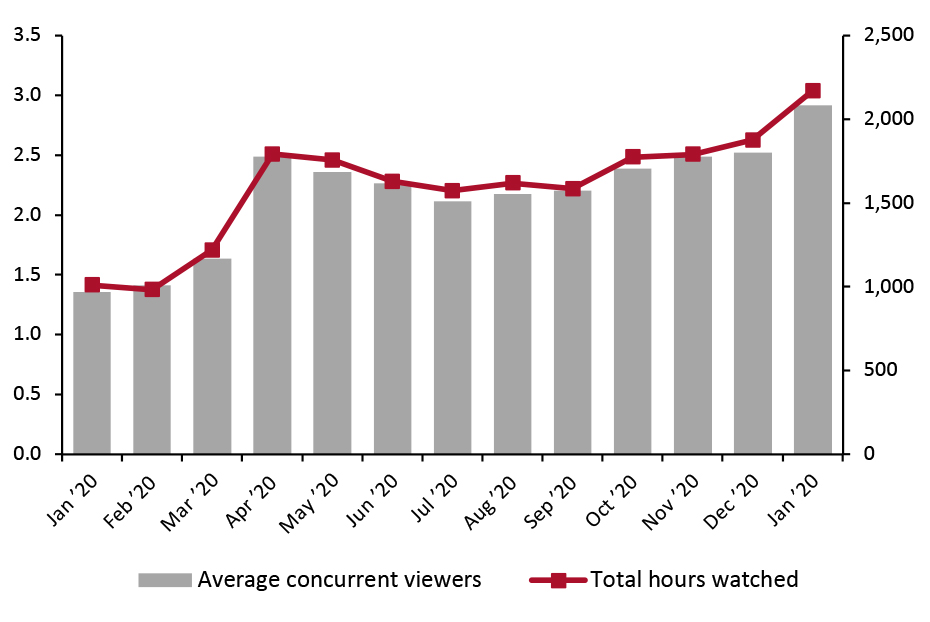 Source: TwitchTracker[/caption]
Typically an arena dominated by “gamers” who tend to skew young and male, Twitch’s audience has grown in size this year, and likely in diversity too. Viewers now have access to a substantially larger array of content than previously: The number of streamers has more than tripled over the past year.
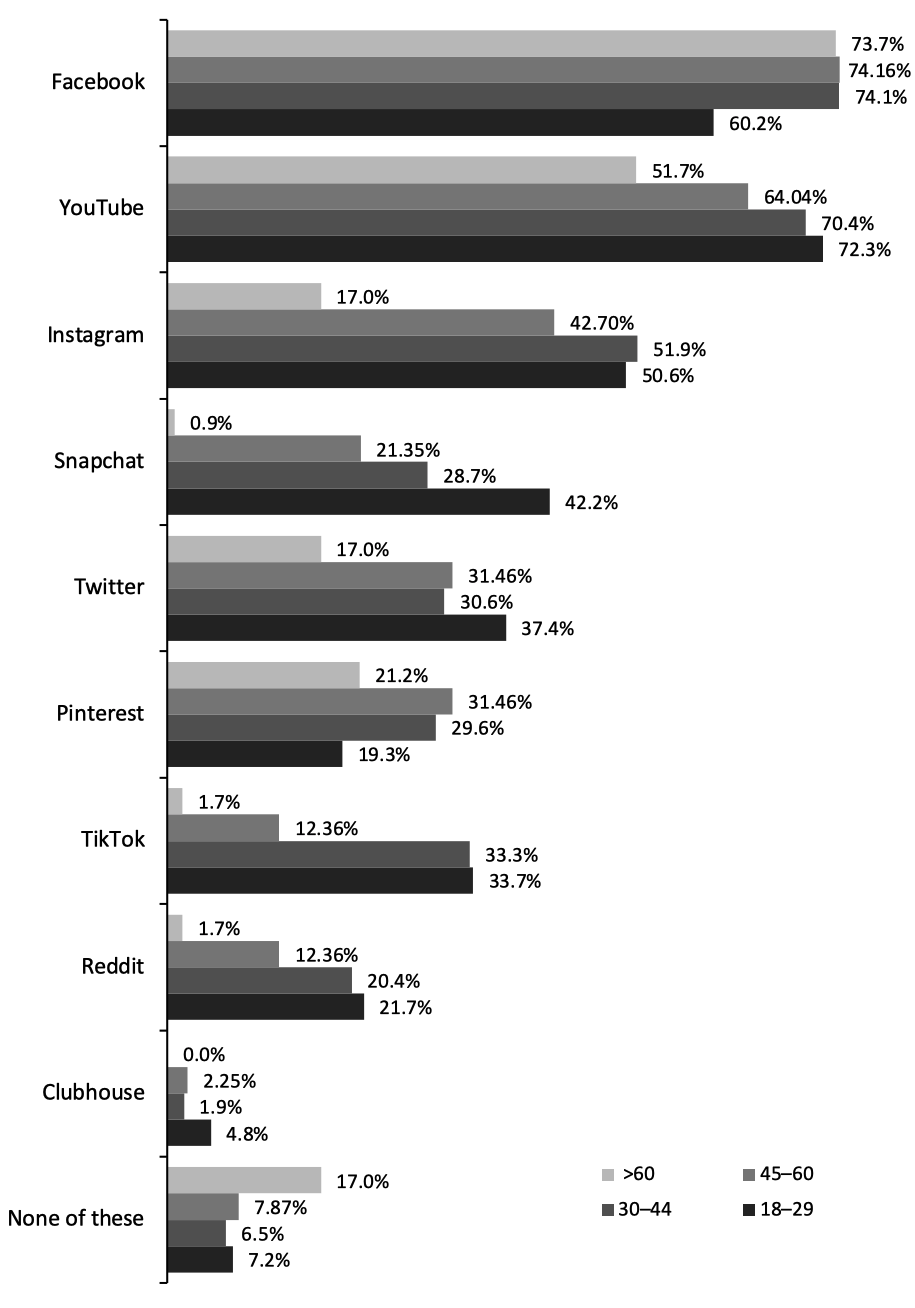
The demographics of the user bases of other digital platforms have also diversified. According to a survey we conducted in February 2021, the platform preferences of older consumers differ substantially from the preferences of younger generations, as illustrated by the figure below. Older consumers tend to use Facebook at rates as high or higher than their younger peers but are far less likely to utilize newer platforms such as TikTok.
Figure 9. Social Media Platforms That US Consumers Use At Least Once a Month (% of Respondents)
[caption id="attachment_125369" align="aligncenter" width="710"]
 Base: US respondents aged 18+, surveyed February 22, 2021
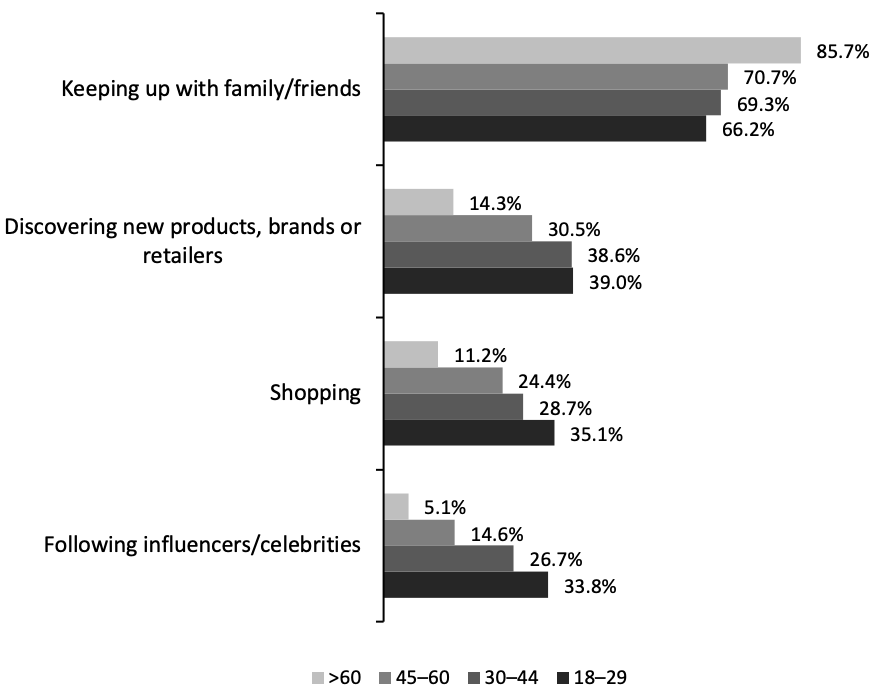
Source: Coresight Research[/caption] Similar age discrepancies appear when examining what consumers use social media for: Older consumers tend to focus their use of social media on simply keeping up with their family and friends, while younger consumers more frequently follow influencers and celebrities and are open to leveraging social media for commerce. Figure 10. What US Consumers Use Social Media For (% of Respondents Who Use Social Media At Least Once a Month) [caption id="attachment_125370" align="aligncenter" width="710"]
 Base: US respondents aged 18+, surveyed February 22, 2021
Source: Coresight Research[/caption] The bottom line of these age discrepancies is that older consumers have adopted social media to an extent, but younger consumers remain the ones using it in ways that can be most effectively leveraged by retailers. Consumers between the ages of 18 and 29 are more than three times as likely as consumers over the age of 60 to use social media to shop. Furthermore, our survey found that social media influencers (who often collaborate with, or are sponsored by, retailers and brands) see strong engagement by 18–29-year-old consumers but weak engagement among consumers aged over 45. Retailers can successfully appeal to all demographics via social and streaming channels, but they must tailor their strategies carefully to the audience that they can most effectively reach on each platform—bearing in mind that younger consumers are more willing to integrate shopping into their social media experience. For example, retailers could look to invest in facilitating more direct purchases through social channels such as TikTok and Snapchat, which have a higher concentration of younger users. Facebook, by contrast, is likely better suited for more traditional advertisements and product placements that can reach older consumers more effectively and sway their purchasing decisions without relying on a mode of commerce that many older consumers still feel uncomfortable with. To fine-tune these strategies, particularly on platforms such as TikTok and Twitch that have an almost unlimited variety of user-created content, brands and retailers must double down on identifying and targeting specific demographics. Collecting detailed consumer data will be central to this strategy. Companies such as The North Face have already begun to segment consumers based on their behaviors, parsing them out into different lifestyle categories ranging from “hiker” to “extreme athlete.” By better understanding the characteristics of consumers on and within each social and streaming platform, retailers can more effectively segment their customer base and lower their online customer-acquisition costs. Finally, retailers can benefit from working with new technology providers that can seamlessly integrate marketing into streamed content. While conventional industry wisdom would suggest that streaming services keep their content as undisrupted by ads as possible, younger generations increasingly expect a “Twitchified” streaming experience that includes a heavy overlay of chats, links and other options. Certain technology startups, such as StreamLayer, are creating ways for retailers and others to interact directly with consumers embedded in the content they consume. StreamLayer provides an overlay on streamed content that can include social media feeds, betting options on sports streams, e-commerce opportunities and other forms of engagement. Moving forward, retailers will likely benefit from working with similar partners to effectively meet consumers where they are. 4. Invest in Loyalty
Trend: Consumers’ spending habits were in fluctuation during the pandemic, leading many to try new brands and engage in new shopping behaviors. --------- Strategy: As variance in shopping habits settles, retailers must invest heavily in cultivating communities and building loyalty to lock in the customers they gained during the pandemic.
Now is a key time for retailers to invest in customer retention through the creation of communities, loyalty programs and personalized support to maintain relationships with customers who changed their shopping behaviors and brand preferences at record rates during the pandemic. One-third of US consumers have switched brands across all retail categories since the start of the pandemic, according to Salesforce, and data from early fall indicate that fully 80% of them plan to keep buying from those new brands following the end of the pandemic. Retailers and brands must work to ensure they can retain the interest and spending of consumers who have switched to their products during the pandemic—it is no given that these consumers will stick with their changed preferences otherwise. Below, we discuss three ways in which brands and retailers can ensure retention of newly acquired customers—and ideally attract back some of the shoppers they lost. Create communities Retailers and brands should look to create a sense of family and community among their customers. NIKE has successfully pivoted to a direct-to-consumer approach, in part through its ability to bring customers together via its owned platforms. NIKE has invested heavily in the SNKRS app, where members can get early access to new product releases and come together under the NIKE roof. The company also operates the NIKE running app, which gives consumers the ability to track their workouts and compare their efforts with others. These communities were a key factor in enabling NIKE to grow sales on its digital platforms by 84% in its most recent reported quarter, ended November 30, 2020. Other brands and retailers could also work to foster communities beyond the store to help generate strong brand loyalty. Invest in loyalty programs Loyalty programs are one of the most effective ways to drive attachment and repeat purchases. Successful loyalty programs often go beyond simply offering consumers points for purchases. The North Face has seen success with its VIPeak program, launched in 2013, which offers consumers rewards for completing activities such as attending events, downloading The North Face app and checking in at certain locations. Retailers are also increasingly integrating a broader range of functionalities into their loyalty apps, including payments, digital offers and online ordering. Many are also rolling out paid loyalty programs following the lead of Amazon Prime—Walmart’s September 2020 launch of Walmart+ being a prime example. These comprehensive programs can add value for retailers beyond the simple retention of customers. Retailers are increasingly monetizing data from their loyalty programs through syndicated data sales. Some, led by Kroger, are also leveraging data from loyalty programs to create a 360-degree view of customers to deliver them more personalized offers and experiences. For example, Sephora’s Beauty Insider rewards program collects data—such as hair color, eye color and skin tone—to generate an individual profile for each member and offer personalized recommendations. Furthermore, customers are able to sort product reviews by shoppers who have similar profile characteristics, helping them to make more informed decisions. Sephora employs a targeted marketing strategy based on this data, to increase the probability of customers engaging with the retailer and making a purchase. Emphasize personalized support Consumers have rising expectations for how frequently and personally brands engage with them. In a 2020 survey conducted by Intercom, a US-based customer relationship software company, 73% of customer support leaders worldwide indicated that customer expectations for support are increasing, and consumers are particularly looking for support that makes them feel valued at an individual level and is customized to them. While many retailers typically focus their personalization efforts on marketing, perhaps the most effective way to harness consumer data is to create personalized support systems for existing and potential customers. Some 79% of US consumers believe that personalized service is more important than personalized marketing, according to a 2020 survey by Gladly, a customer service solutions platform. Where consumers tend to grow averse to “creepy” personalized advertising, personalized support tends to make customers feel more valued and can drive repeat purchasing. Retailers and brands should emphasize personalized support across selling channels. Audio electronics brand Sonos has seen success from personally engaging with consumers over social media, not only driving them to be repeat purchasers but also enlisting them as brand ambassadors on social channels. On e-commerce sites, automated chatbots can help retailers leverage consumer data to improve response times to queries and create personalized product recommendations. In-store personalized support is also vital, beyond simply employing motivated, attentive associates. Retailers can see benefits from deploying technology such as virtual and augmented reality (e.g., try-on mirrors) to help consumers have a more customized, personal experience in stores. 5. Rethink the StoreTrend: Consumers are eager to get back to pre-crisis normality and social behaviors. --------- Strategy: Retailers must reimagine the store to be an engaging destination for social consumers by leveraging new technologies to develop immersive physical experiences and integrate offline and online shopping.
While retailers must ensure they understand and appeal to consumers over digital channels, consumers are looking to get back to greater in-person socializing. This means that in the second half of 2021, retailers will face stiffer competition for the dollars of consumers from the service and experience industry than they have over the past 12 months. To continue to ride strong growth, retailers must refocus their efforts on reimagining the store and making it an integral part of consumers’ lives outside the home by creating a seamless omnichannel purchase experience and leveraging new technology to create more engaging in-person experiences. We have already begun to see indications of consumers returning to more normal social behaviors: In our March 8 consumer survey, 48.8% of respondents reported meeting up with friends or family in the prior two weeks, a more than 10-percentage-point increase from just a month prior. Furthermore, since the start of the year, the proportion of consumers reporting in our weekly survey that they are avoiding restaurants and bars has decreased by more than 20 percentage points since the beginning of the year, as shown in Figure 11. Figure 11. US Consumers Who Are Avoiding Restaurants and Bars, 2021 (% of Respondents) [caption id="attachment_125371" align="aligncenter" width="710"]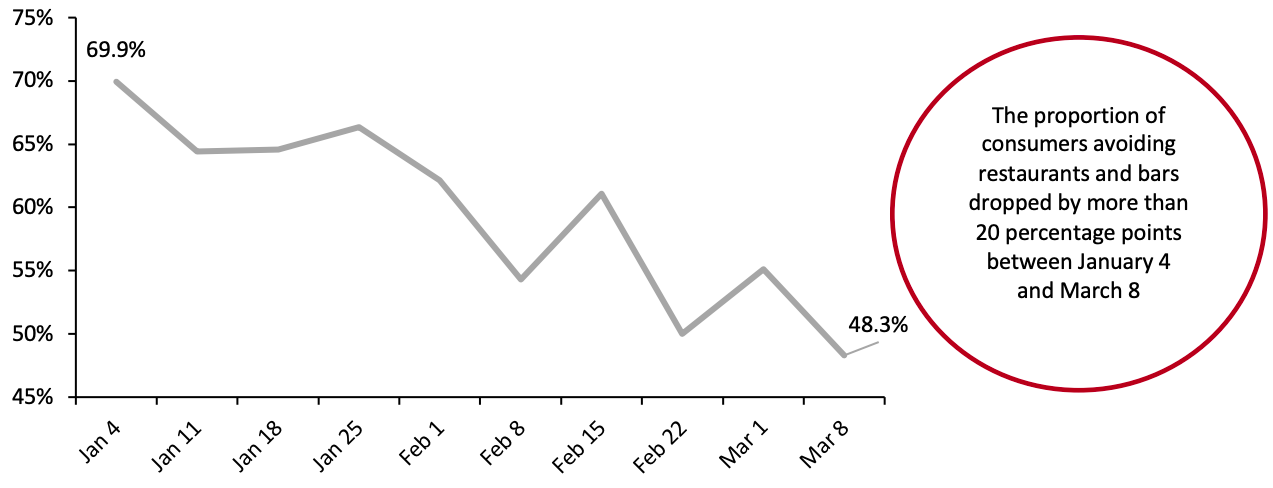 Base: US consumers aged 18+
Source: Coresight Research[/caption] Likewise, recent pickups in weekend air travel, illustrated in the figure below, indicate that consumers are finally getting back to vacationing and seeing friends and family. Figure 12. US Air Travel: Weekend* vs. Weekday Change (YoY %) [caption id="attachment_125457" align="aligncenter" width="725"]
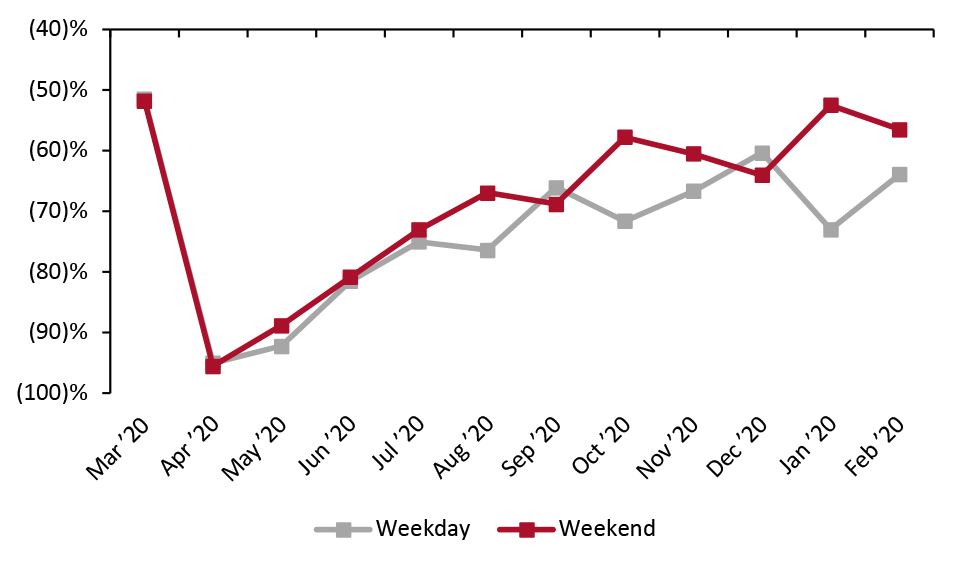 *Weekend includes Friday, Saturday, Sunday and Monday
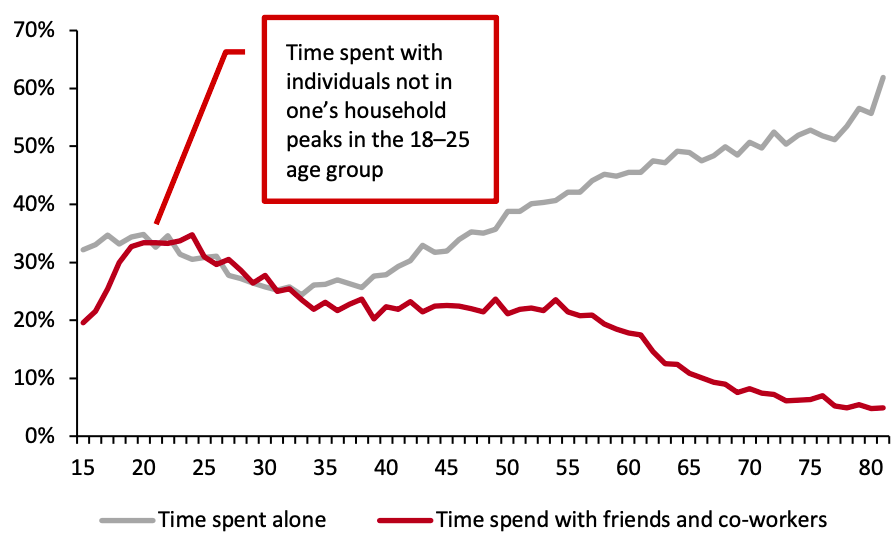
Source: TSA/Coresight Research[/caption] Retailers should not take a one-size-fits-all approach to adjusting to a return to social life. Instead, retailers should focus on creating in-store experiences that appeal to younger shoppers, particularly those between the ages of 18 and 25, which is the only consumer group that tends to spend at least 30% of their time with friends or co-workers (individuals outside of their household), according to data amalgamated from various surveys conducted between 2009 and 2019 by Our World in Data (see Figure 13). Figure 13. Time Spent Alone vs. with Co-Workers and Friends, by Age (% of Total Time) [caption id="attachment_125373" align="aligncenter" width="710"]
 Source: Our World in Data[/caption]
When widespread vaccination makes socializing safer, the most drastic increases in social behaviors are likely to come from younger individuals. Retailers can take two key steps to ensure the store becomes an integral part of these social consumers’ post-pandemic lives, as we outline below.
Create a Seamless Omnichannel Purchase Experience
Consumers now expect their shopping experience to be integrated online and offline. Some 81% of consumers conduct online research before shopping in stores, while 65% of consumers look up product information online while they are shopping in-store, according to data from GE Capital Retail Bank and KPMG. By leveraging omnichannel inventory management solutions, retailers can ensure they offer an “endless aisle” to consumers in-store, connecting them to online purchase options and in-stock statuses at other locations. Expansion of BOPIS and curbside-pickup options will also be key to attracting digitally native consumers to stores moving forward, even as pandemic fears fade.
Leverage New Technologies To Make the Store Experience More Engaging
New technologies, particularly augmented and virtual reality, will likely play a role in attracting consumers back to stores. Retailers must ensure that they are employing these technologies for functional or fun purposes, not just as flashy gimmicks. Recently, we have begun to see early-stage developments in this area: At NRF 2021, this year’s edition of the annual two-week show hosted in January by the National Retail Federation, presenters of an experimental London retail shop called “CornerShop” exhibited how augmented reality on mobile devices could be used to direct consumers to products that fit their dietary needs in-store.
Retail tech startup Outernets also combines smart displays and sensors to capture consumer motion and behavior, fueled by artificial intelligence, to create interactive, immersive experiences within physical stores that engage and enthrall consumers, providing them with compelling experiences.
We expect to see substantially more use of these creative digital mediums in stores in the second half of 2021.
What We Think
Retailers have done well to adapt to changes brought on by the pandemic, but maneuvering beyond the crisis will arguably be an equally challenging task. Implications for Brands/Retailers- In the wake of the pandemic, geographical and economic disparities in behavior—driven in no small part by the potential permanent shift to working from home for many—will be greater than pre-crisis, forcing retailers to rethink their segmentation strategies.
- While younger segments can remain a priority, retailers can capitalize on the mass entry of older consumers to the world of online shopping.
- Consumers are increasingly spending their time on new digital mediums, where the range of content is wide and creators are abundant—retailers must meet consumers where they are and integrate commerce into new digital media channels.
- While consumers have shifted their spending drastically during the pandemic, retailers should now look to lock in consumers who have switched to them, through personalized support, loyalty programs and the creation of communities.
- As consumers look to return to socializing and getting out of the house more and the retail industry faces increased competition from service providers, retailers must leverage new technologies to make the store an appealing destination.