
albert Chan
[caption id="attachment_80435" align="aligncenter" width="660"]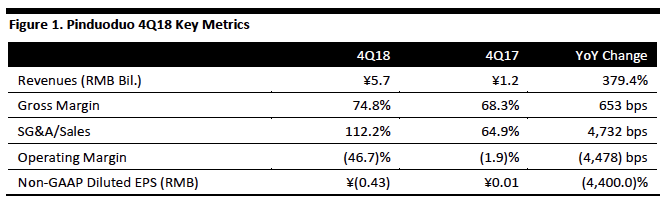 Source: Company reports/Coresight Research[/caption]
4Q18 Results
Pinduoduo recorded revenues of ¥5.7 billion for the fourth quarter ended December 31, 2018, beating the consensus estimate of ¥5.2 billion and up 379.4% year over year. Revenue growth was driven by a broader buyer base and enhanced user engagement. FY18 revenues were ¥13.1 billion, up 652% year over year due primarily to contributions from online marketing services.
4Q18 revenues were broken down as follows:
Source: Company reports/Coresight Research[/caption]
4Q18 Results
Pinduoduo recorded revenues of ¥5.7 billion for the fourth quarter ended December 31, 2018, beating the consensus estimate of ¥5.2 billion and up 379.4% year over year. Revenue growth was driven by a broader buyer base and enhanced user engagement. FY18 revenues were ¥13.1 billion, up 652% year over year due primarily to contributions from online marketing services.
4Q18 revenues were broken down as follows:
- Online marketing services revenues were ¥5.1 billion, up 470% year over year.
- Transaction services revenues were ¥591.5 million, up 103% year over year.
- Sales and marketing expenses were ¥6.0 billion, up 699% year over year, primarily due to increased spending on online and offline advertisement and promotion and branding campaigns.
- General and administrative expenses were ¥321.6 million, increasing significantly from ¥11.6 million in the same quarter last year.
- Research and development expenses were ¥525.2 million, increasing 901% year over year primarily due to increased recruitment costs of R&D personnel and R&D-related cloud services expenses.
- GMV for the 12 months ended December 31, 2018 was ¥471.6 billion, up 234% year over year. This was due to strong growth of annual active buyers and an increase of nearly double in annual spend per active buyer.
- Active buyers for the 12 months ended December 31, 2018 were 418.5 million, increasing 71% year over year.
- Annual spending per active buyer for the 12 months ended December 31, 2018 was ¥1,126.9, increasing 95% from ¥576.9 in the same period last year.
- Average monthly active users in the quarter were 272.6 million, increasing 93% from 141.0 million in the same quarter last year.