Nitheesh NH
[caption id="attachment_81828" align="aligncenter" width="640"]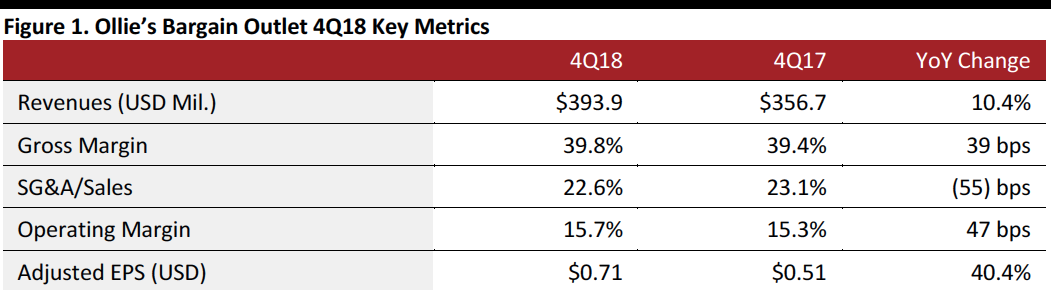 Source: Company reports/Coresight Research[/caption]
4Q18 Results
Ollie’s reported 4Q18 revenues of $393.9 million, up 10.4% but missing the $398.2 million consensus estimate. The sales increase was driven by a 13.1% increase in store count. Sales increased 15.8% excluding the 53rd week in the year-ago quarter. Management commented that despite strong holiday sales, a winter storm during the busiest weekend in January caused the company to miss its guidance for annual sales of $1.24 billion.
The gross margin increase was due to higher merchandise margin, partially offset by higher supply chain costs as a percentage of sales.
Comps increased 5.4%, up from 4.4% in the year-ago quarter but missing the 6.0% consensus estimate.
Adjusted EPS was $0.71, up 40.4% and beating the consensus estimate by a penny, excluding the charges listed in the discussion of FY18 results below. GAAP EPS was $0.76, down 29.5% from $1.07 in the year-ago quarter.
FY18 Results
FY18 revenues were $1.24 billion, up 15.3%. The sales increase was also driven by a 13.1% increase in store count.
Comps increased 3.3%, compared to an increase of 3.3% the prior year.
Adjusted EPS was $1.83, up 46.4% from $1.25 the prior year, excluding adjustments for losses on the extinguishment of debt, adjustments to provisions for income taxes and excess tax benefits related to stock-based compensation. GAAP EPS was $2.05, up 4.3% from $1.96 the prior year. The year-ago GAAP figure includes a $0.50 per share charge for tax benefits due to the 2017 Tax Act.
Capital expenditures increased dramatically to $74.2 million compared to $19.3 million in the prior year, primarily due to the purchase of 12 former Toys “R” Us store sites, new store growth and investments in the third distribution center.
Details from the Quarter
Source: Company reports/Coresight Research[/caption]
4Q18 Results
Ollie’s reported 4Q18 revenues of $393.9 million, up 10.4% but missing the $398.2 million consensus estimate. The sales increase was driven by a 13.1% increase in store count. Sales increased 15.8% excluding the 53rd week in the year-ago quarter. Management commented that despite strong holiday sales, a winter storm during the busiest weekend in January caused the company to miss its guidance for annual sales of $1.24 billion.
The gross margin increase was due to higher merchandise margin, partially offset by higher supply chain costs as a percentage of sales.
Comps increased 5.4%, up from 4.4% in the year-ago quarter but missing the 6.0% consensus estimate.
Adjusted EPS was $0.71, up 40.4% and beating the consensus estimate by a penny, excluding the charges listed in the discussion of FY18 results below. GAAP EPS was $0.76, down 29.5% from $1.07 in the year-ago quarter.
FY18 Results
FY18 revenues were $1.24 billion, up 15.3%. The sales increase was also driven by a 13.1% increase in store count.
Comps increased 3.3%, compared to an increase of 3.3% the prior year.
Adjusted EPS was $1.83, up 46.4% from $1.25 the prior year, excluding adjustments for losses on the extinguishment of debt, adjustments to provisions for income taxes and excess tax benefits related to stock-based compensation. GAAP EPS was $2.05, up 4.3% from $1.96 the prior year. The year-ago GAAP figure includes a $0.50 per share charge for tax benefits due to the 2017 Tax Act.
Capital expenditures increased dramatically to $74.2 million compared to $19.3 million in the prior year, primarily due to the purchase of 12 former Toys “R” Us store sites, new store growth and investments in the third distribution center.
Details from the Quarter
- Management commented that the quarter represented the 19th consecutive quarter of positive comps, and characterized performance in the toy category as outstanding.
- Ollie’s opened six stores during the quarter, ending the quarter and year with 303 stores in 23 states, an increase of 13.1% year over year.
- Strong categories in the quarter included housewares, floor coverings, health and beauty and candy.
- Management’s growth strategy centers on three main drivers: offering compelling deals; growing the store base and leveraging and expanding Ollie’s Army (members of the company’s loyalty program).
- New stores remain the company’s biggest growth driver. Ollie’s opened a net total of 35 new stores in 2018 and entered three new states: Louisiana, Arkansas and Texas. The company has already opened 12 new stores in 2019, including seven in former Toys “R” Us locations.
- In 2019, the company plans to open 42-44 new stores and views Ollie’s potential as more than 950 stores in the US, more than three times the current store base, which offers substantial potential for growth.
- Ollie’s third distribution center, located in Lancaster, Texas, is currently under construction, occupying a 615,000 square-foot facility and expected to be operational during 1Q20.
- Ollie’s Army now has more than nine million members, who contribute 70% of sales.
- Members shop more often and their average spend is considerably higher than nonmembers. The company held a record Ollie’s Army Night in December, which likely contributed to its strong holiday performance.
- Challenges in Q1 include unfavorable weather in the early weeks of the quarter and the shift in the timing of Easter, which fell in March 31 in 2018, versus April 21 in 2019.
- Revenues of $1.43-1.44 billion, up 16-17% but slightly below the $1.45 billion consensus.
- The opening of 42 to 44 new stores, including the first stores in Oklahoma and Massachusetts.
- Comps to increase 1-2%.
- Adjusted EPS of $2.10-2.15, up 15-18% but below the $2.15 consensus estimate.
- Capital expenditures of $75-80 million, primarily for the construction of and equipment for a new distribution center, new stores, IT projects and store-level initiatives. Management expects the new distribution center to position the company for a long runway of future growth.