DIpil Das
The Coresight Research US Retail Traffic and In-Store Metrics series reviews changes in selected store-based metrics, as reported by RetailNext. In this month’s report, we review store traffic changes through October 2021—which saw an overall improvement in traffic, with trends impacted by early holiday shopping. This series usually reviews year-over-year changes in store-based metrics; however, all March, April, May, June and July 2021 data in this report are compared to 2019, while August, September and October 2021 data are compared to 2020—as stores began closing in March 2020 due to Covid-19 and most stores were closed in April, May, June and July 2020, but began reopening in August and most were opened in September and October. This is our first monthly report in 2021 that covers year-over-year changes.
RetailNext’s coverage does not include food retailers but does include some other retail sectors deemed essential; the exclusion of food retail means that the figures cited below almost certainly overstate recent declines in total retail traffic.
Figure 1. US Store-Based Nonfood Retail Metrics: YoY % Change [caption id="attachment_136162" align="aligncenter" width="725"]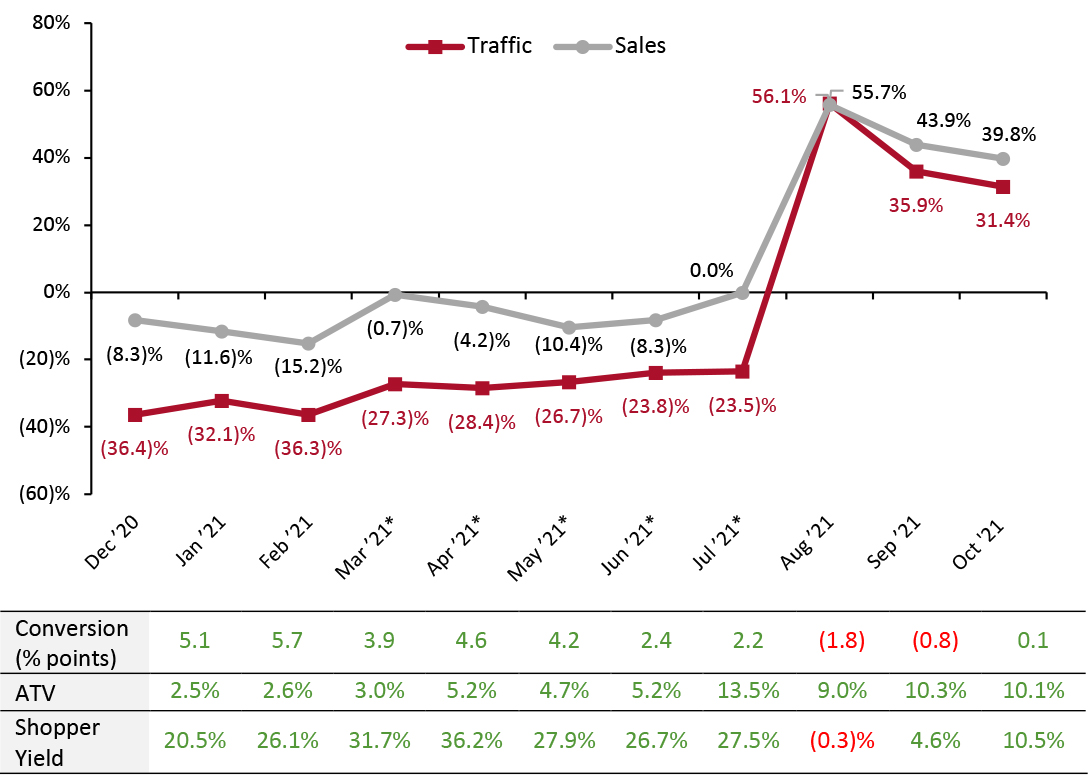 ATV=average transaction value; Shopper yield=Sales divided by traffic
*March, April, May, June and July 2021 numbers are compared to 2019 as stores began closing in March 2020 due to Covid-19 and most stores were closed in April, May, June and July 2020. After July 2021, metrics revert to year-over-year changes.
Source: RetailNext [/caption] Weekly Shopper Traffic Trends Weekly data for October tracks the progress of store traffic over four weeks (October 3–October 30, 2021):
Figure 2. US Retail Traffic by Industry Vertical: YoY % Change [caption id="attachment_136163" align="aligncenter" width="724"]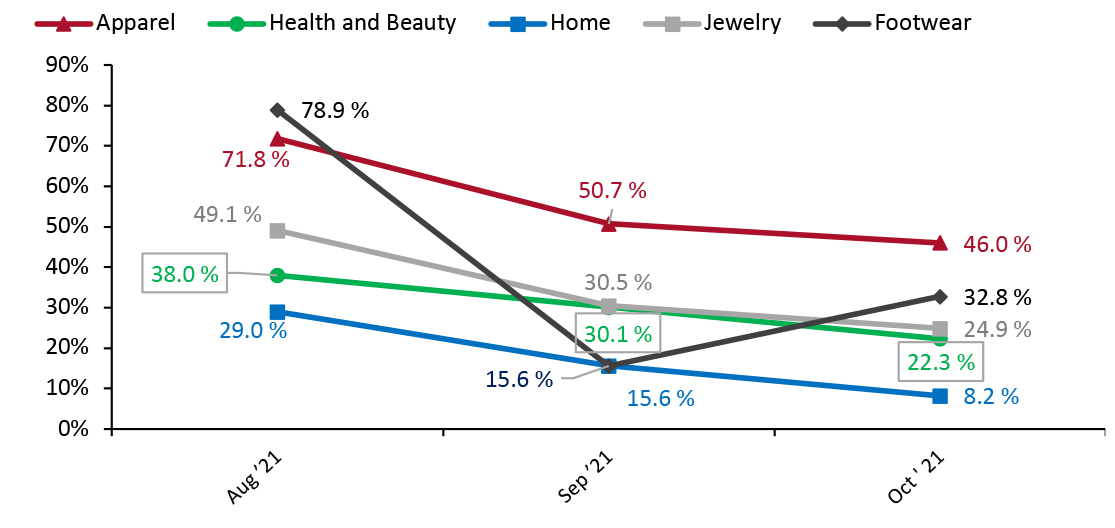 RetailNext started providing traffic trends on a year-over-year basis commencing from August 2021.
Source: RetailNext [/caption] Regional Traffic Trends New Covid-19 cases were on a downward trend for most of October but grew slightly at the end of the month. The state of Alaska passed an emergency ordinance for an indoor mandate for all citizens age five and above on October 12. The West has the highest number of mask mandates per region, including in Alaska, Hawaii, New Mexico, Oregon, California, Nevada and Washington. Additionally, San Francisco requires proof of vaccination for entering indoor businesses and Los Angeles has also passed a similar mandate, effective in November. In the Northeast region, state-wide mask mandates are in effect in New York and Connecticut, alongside Illinois in the Midwest and Louisiana in the South. In the final week of October, heavy rains and strong winds caused flooding and debris in California, while strong winds but minimal rainfall affected Oregon and Washington—causing California’s traffic trend to hit 28.0% on a year-over-year basis in the fourth week, down from the third week’s 42.0%, and Washington’s to decline 31.0% in the third week to 28.0% in the fourth. Retail traffic in October varied across regions:
- October saw an improvement in traffic trends: Traffic increased by 31.4% in October on a year-over-year basis, lower than September’s 35.9% increase year over year. These increases are against very weak comparatives: Traffic was down 34.5% year over year in October 2020, following a 34.1% decline in September 2020.
- The conversion rate (sales transactions as a percentage of traffic) grew 0.1 percentage points in October, versus September’s 0.8 percentage points decline.
- In recent months, ATV (average transaction value, or sales divided by transactions) has increased meaningfully as shoppers buy more on each trip than they did one year ago. This trend continued in October, when ATV increased by 10.1%, but the growth rate eased by 0.2 percentage points from September. This fueled an increase in store-based sales of 39.8%, 4.1 percentage points lower than in September 2021.
- Shopper yield (sales divided by traffic) increased by 10.5% in October, higher than September’s 4.6% growth.
Figure 1. US Store-Based Nonfood Retail Metrics: YoY % Change [caption id="attachment_136162" align="aligncenter" width="725"]
ATV=average transaction value; Shopper yield=Sales divided by traffic *March, April, May, June and July 2021 numbers are compared to 2019 as stores began closing in March 2020 due to Covid-19 and most stores were closed in April, May, June and July 2020. After July 2021, metrics revert to year-over-year changes.
Source: RetailNext [/caption] Weekly Shopper Traffic Trends Weekly data for October tracks the progress of store traffic over four weeks (October 3–October 30, 2021):
- On a week-by-week basis, traffic performance improved as the month progressed, recording the lowest performance in the first week on a year-over-year basis and the highest in the last—caused by early holiday shopping.
- In the first week, traffic increased by 26.8%—deteriorating from the final week of September, which saw a traffic increase of 33.3%.
- Traffic accelerated significantly to 29.8% in the second week of October and further increased to 31.5% in the third. In the final week, it increased by 35.4%.
- Apparel was the strongest performing category in October, witnessing a 46.0% increase in traffic, as shoppers commenced buying for the holiday season and returned to the office. Despite being the best performer, it was still 440 basis points below its September level.
- In October, footwear was the second-best performing category, increasing by 32.8% year over year and 140 basis points higher than September. Footwear trends increased throughout the month and peaked in the fourth week, reaching 39.0%. This category is likely to remain strong as people shop for the holidays.
- Traffic in the jewelry category increased by 24.9% year over year and outperformed half of the published categories—although, it still remained 550 basis points below September’s trends.
- The health and beauty category saw a traffic increase of 22.3% on a year-over-year basis; however, it decreased by 780 basis points from September. Even though the category underperformed the national average, traffic trends improved consistently throughout the month.
- The softest trend was seen in the home category, recording an 8.2% year-over-year increase. In October, traffic declined from the first week to the third—however, it increased in the last week, reaching 13.0%.
Figure 2. US Retail Traffic by Industry Vertical: YoY % Change [caption id="attachment_136163" align="aligncenter" width="724"]
RetailNext started providing traffic trends on a year-over-year basis commencing from August 2021. Source: RetailNext [/caption] Regional Traffic Trends New Covid-19 cases were on a downward trend for most of October but grew slightly at the end of the month. The state of Alaska passed an emergency ordinance for an indoor mandate for all citizens age five and above on October 12. The West has the highest number of mask mandates per region, including in Alaska, Hawaii, New Mexico, Oregon, California, Nevada and Washington. Additionally, San Francisco requires proof of vaccination for entering indoor businesses and Los Angeles has also passed a similar mandate, effective in November. In the Northeast region, state-wide mask mandates are in effect in New York and Connecticut, alongside Illinois in the Midwest and Louisiana in the South. In the final week of October, heavy rains and strong winds caused flooding and debris in California, while strong winds but minimal rainfall affected Oregon and Washington—causing California’s traffic trend to hit 28.0% on a year-over-year basis in the fourth week, down from the third week’s 42.0%, and Washington’s to decline 31.0% in the third week to 28.0% in the fourth. Retail traffic in October varied across regions:
- The Northeast saw the strongest traffic trend in October, growing 35.3% year over year. Trends improved consistently throughout the month. New York’s traffic trend declined from 52.0% in the third week to 48.0% in the fourth, due to storm-induced heavy rains.
- The South saw an increase of 31.8% year over year, with trends improving every week throughout the month, as in the Northeast.
- In the West, traffic also improved by 31.8% year over year; however, it declined by 12 percentage points from September. Nevertheless, the region outperformed the South in the first and second weeks and outperformed all regions in the third and fourth weeks.
- The Midwest recorded the softest traffic trends in October at 30.5% but still improved from September’s 28.3% year-over-year increase. The traffic trend declined in the second week but improved toward the end of the month.
- Traffic by mall location type increased between 22.2% and 50.3%. Luxury locations outperformed all other location types, increasing by 50.3%—while strip malls performed the weakest this month, registering 22.2% growth.
- Other retail locations, including airports, casinos and hotels, reported a traffic increase of 43.7%.
- Lifestyle centers recorded a traffic increase of 39.8%.
- Street-front/freestanding locations saw a traffic increase of 39.7%, while traditional malls reported a traffic increase of 36.9%.