DIpil Das
The Coresight Research US Retail Traffic and In-Store Metrics series reviews year-over-year changes in selected store-based metrics as reported by RetailNext. In this month’s report, we review store traffic changes through October, when many states reported a spike in Covid-19 cases. RetailNext’s coverage does not include food retailers but does include some other retail sectors deemed essential; the exclusion of food retail means that the figures cited below almost certainly overstate recent declines in total retail traffic.
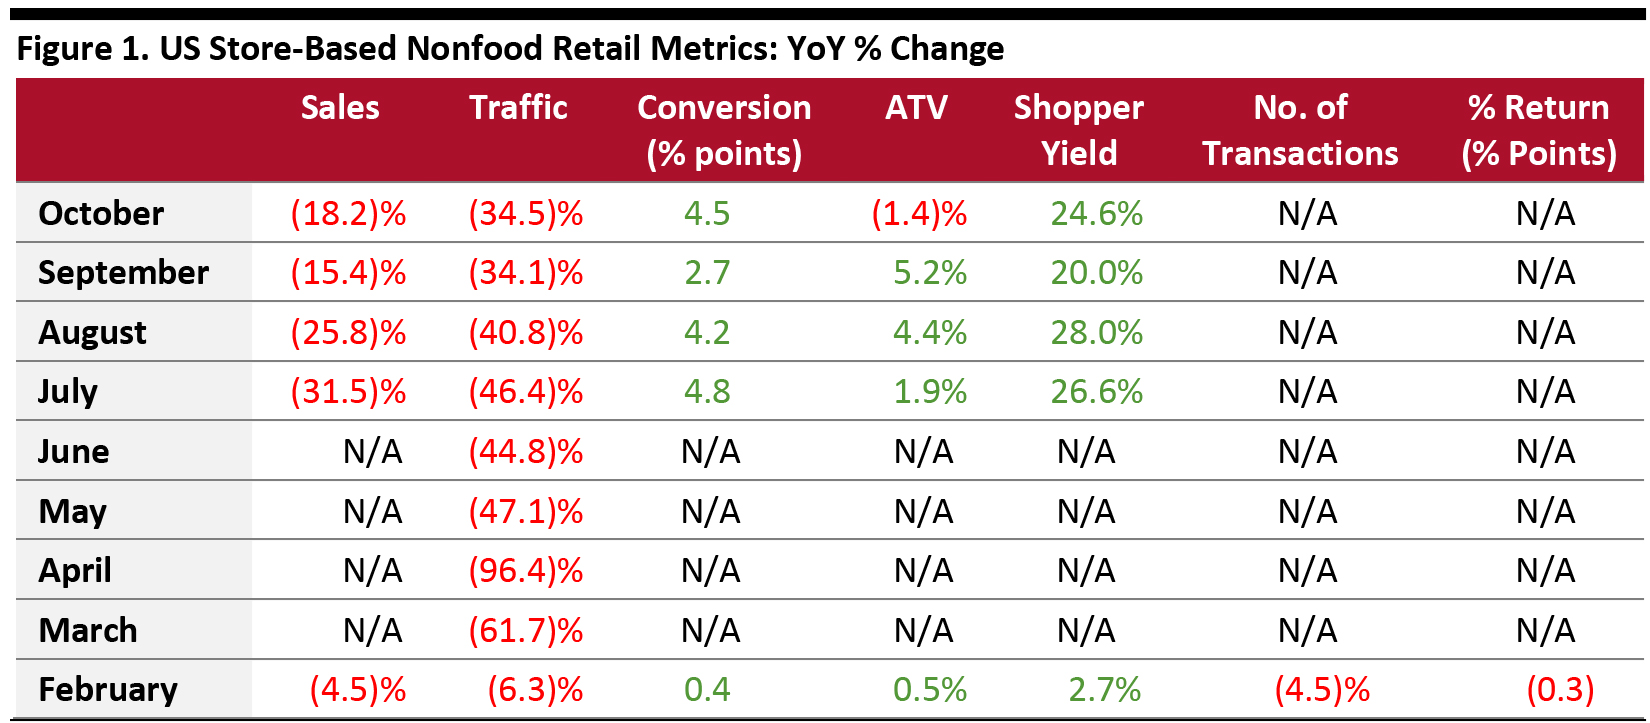 ATV=average transaction value; % Return=percentage of goods returned to stores
Source: RetailNext [/caption] Weekly Shopper Traffic Trends Weekly data for October tracks the progress of store reopenings over four weeks (October 4–October 31, 2020):
- Total US nonfood traffic declined by 34.5% year over year in October, versus September’s 34.1% decline. The decline is in line with Coresight Research’s expectationsfor total US nonfood retail traffic to be down by around 30–35% during the holiday season (October to December).
- The conversion rate (sales transactions as a percentage of traffic) grew by 4.5 percentage points in October, versus September’s 2.7-percentage-point growth.
- In October, ATV (sales divided by transactions) decreased by 1.4%, versus September’s 5.2% growth.
- Shopper yield (sales divided by traffic) grew 24.6% in October, versus September’s 20.0% increase.
- RetailNext did not publish data for transaction volume and product return rates.
ATV=average transaction value; % Return=percentage of goods returned to stores Source: RetailNext [/caption] Weekly Shopper Traffic Trends Weekly data for October tracks the progress of store reopenings over four weeks (October 4–October 31, 2020):
- Traffic declined by 33.1% in the first week, an improvement from the final week of September, which saw traffic decline by 34.0%. Traffic declines accelerated slightly to 34.4% in the second week of October; this week also witnessed consumers starting their holiday shopping, with Amazon Prime Day on October 13–14 and other retailers offering promotions to compete against the online giant—resulting in a traffic decline of only 27.6% on these two days.
- Declines eased slightly to 33.8% in the third week of October before accelerating to 36.7% in the fourth week, similar to early September traffic trends, as several states saw a spike in Covid-19 cases.
- The jewelry sector experienced the greatest traffic decline at 34.3%, followed by the apparel sector, which saw a 33.9% decrease in traffic.
- The footwear sector posted the lowest decline in traffic, at 26.8%.
- The home sector reported a traffic decline of 27.9%.
- The Northeast saw the greatest traffic decline of 38.8%, as this region had tighter restrictions related to the pandemic. October started out strong, with a traffic decline of only 35.7%, but in the second to fourth weeks, traffic declines in the region were at least six percentage points worse than the national average.
- The Southposted the lowest decline in traffic, at 31.5%, mainly driven by better traffic trends in Alabama, South Carolina and Tennessee. This region outperformed other regions every week in October, except the third.
- The West was the second-best-performing region, posting a traffic decline of 32.3%. Many states in the region—such as California, Oregon and Washington—witnessed slight improvements in traffic versus September. Although California witnessed a spike in Covid-19 cases in the summer, the state managed to reopen key parts of the economy without seeing a rise in cases, probably contributing to the Western region’s slightly better performance in October compared to the Northeast and the Midwest regions.
- The Midwest posted a traffic decline of 32.8%. This region saw the highest number of Covid-19 cases and hospitalizations in October. As cases rise further, this negative trend is projected to continue in the upcoming months.
- Traffic by mall location type declined between 20% and 50%, with strip malls outperforming other location types by more than 13 percentage points, with a decline of only 21.7%; these benefitted from being open-air centers and the presence of nondiscretionary retailers such as food retailers.
- Luxury, outlet, lifestyle center, street-front and traditional mall locations witnessed traffic declines of between 35% and 39%.
- Other retail locations including airports, casinos and hotels were hit the hardest, with traffic declines of 49.5%, owing to travel restrictions as well as consumer preference to avoid travel.