DIpil Das
The Coresight Research US Retail Traffic and In-Store Metrics series reviews changes in selected store-based metrics, as reported by RetailNext. In this month’s report, we review store traffic changes through November 2021—which saw an overall improvement in traffic, with trends supported by early holiday shopping. This series usually reviews year-over-year changes in store-based metrics; however, all March, April, May, June and July 2021 data in this report are compared to 2019, while August, September, October and November 2021 data are compared to 2020—since stores began closing in March 2020 due to Covid-19 and most stores were closed in April, May, June and July 2020, but began reopening in August and most were opened in September, October and November.
RetailNext’s coverage does not include food retailers but does include some other retail sectors deemed essential; the exclusion of food retail means that the figures cited below almost certainly overstate pandemic-driven declines in total retail traffic.
Figure 1. US Store-Based Nonfood Retail Metrics: YoY % Change [caption id="attachment_138146" align="aligncenter" width="700"]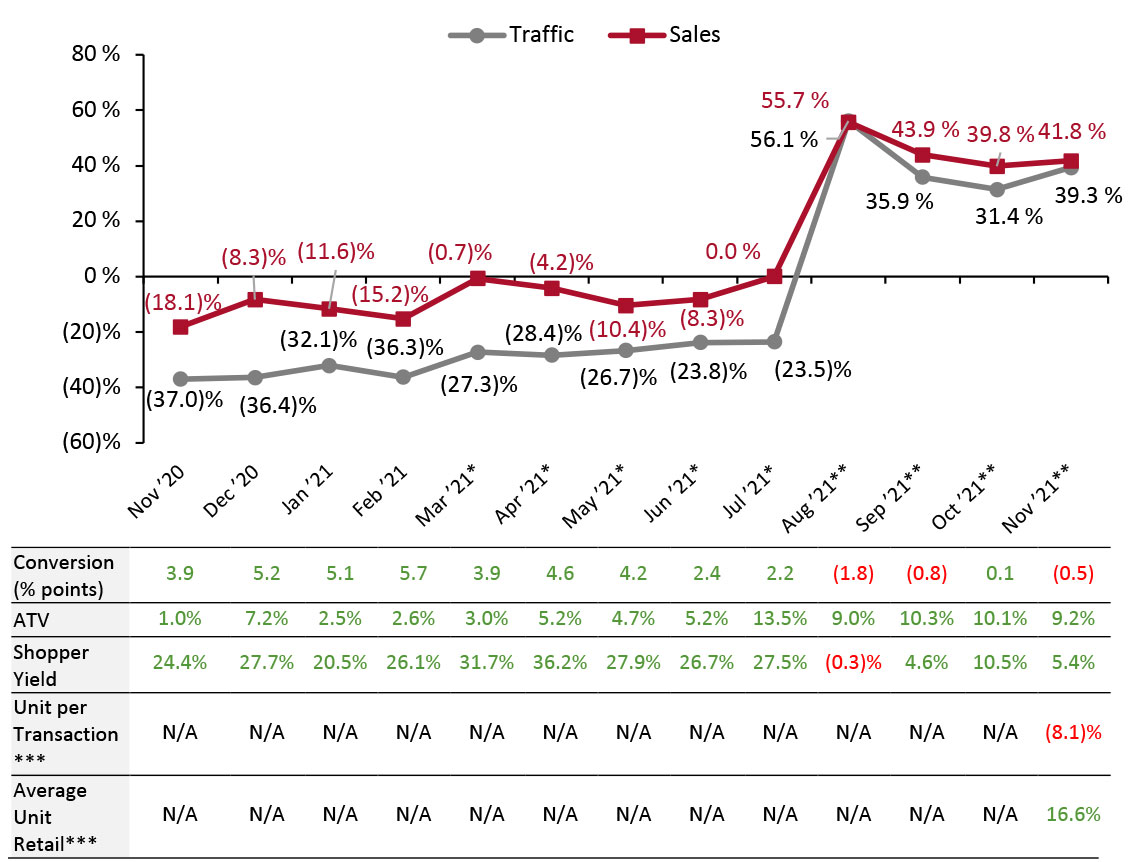 ATV=average transaction value; Shopper yield=Sales divided by traffic
*March, April, May, June and July 2021 numbers are compared to 2019 as stores began closing in March 2020 due to Covid-19 and most stores were closed in April, May, June and July 2020.
**August, September, October and November 2021 numbers are compared to 2020 as stores began reopening in August and most were open by September, October and November.
***RetailNext started providing data on these from November 2021.
Source: RetailNext [/caption] Weekly Shopper Traffic Trends Weekly data for November tracks the progress of store traffic over four weeks (October 31–November 27, 2021):
Figure 2. US Retail Traffic by Industry Vertical: YoY % Change [caption id="attachment_138147" align="aligncenter" width="700"]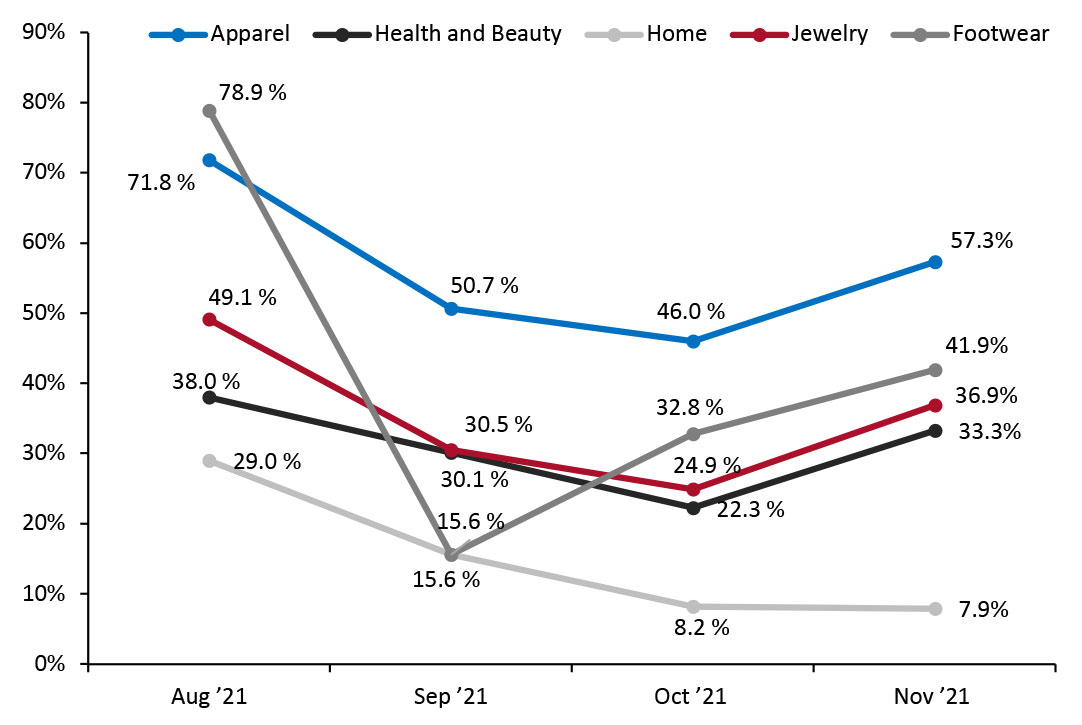 RetailNext started providing traffic trends on a year-over-year basis from August 2021.
Source: RetailNext [/caption] Regional Traffic Trends Numbers of new Covid-19 cases increased in mid-November and saw an uptick after Thanksgiving. In late October, the Food and Drug Administration (FDA) gave authorization for the Pfizer-BioNTech Covid-19 vaccine to be administered to children aged 5–11 years old. In mid-November the Centers for Disease Control and Prevention (CDC) also authorized the Pfizer-BioNTech and Moderna Covid-19 vaccines to be administered as a third “booster” shot to all US adults. These moves give added protection to children and vaccinated adults, which should boost consumer confidence over the holidays. In early November, the US relaxed its border restrictions, allowing fully vaccinated travellers from 33 nations to enter with no quarantine requirement. However, restrictions were reintroduced on November 27 on travellers from South Africa and seven other southern African countries due to the newly discovered Omicron variant. Omicron was not yet a domestic issue in November—the first US case was reported on December 1. Retail traffic in November varied across regions:
- November saw an improvement in traffic trends: Traffic increased by 39.3% in November on a year-over-year basis, higher than October’s 31.4% increase year-over-year.
- The conversion rate (sales transactions as a percentage of traffic) declined 0.5 percentage points in November, down from October’s 0.1 percentage points growth.
- ATV (average transaction value, or sales divided by transactions) continued to increase strongly year over year, although the pace of that change eased by 0.9 percentage points from October, to 9.2%. The easing of ATV growth typically coincides with strengthening growth in traffic, reflecting the disaggregation of purchases into more shopping trips.
- Shopper yield (sales divided by traffic) increased by 5.4% in November, down from October’s 10.5% growth.
- Unit per transaction (number of items purchased divided by number of transactions) decreased by 8.1%.
- Average unit retail (net sales divided by units sold) increased by 16.6%.
Figure 1. US Store-Based Nonfood Retail Metrics: YoY % Change [caption id="attachment_138146" align="aligncenter" width="700"]
ATV=average transaction value; Shopper yield=Sales divided by traffic *March, April, May, June and July 2021 numbers are compared to 2019 as stores began closing in March 2020 due to Covid-19 and most stores were closed in April, May, June and July 2020.
**August, September, October and November 2021 numbers are compared to 2020 as stores began reopening in August and most were open by September, October and November.
***RetailNext started providing data on these from November 2021.
Source: RetailNext [/caption] Weekly Shopper Traffic Trends Weekly data for November tracks the progress of store traffic over four weeks (October 31–November 27, 2021):
- On a week-by-week basis, traffic performance improved as the month progressed, recording the weakest performance in the second week on a year-over-year basis and the highest in the last—influenced by Black Friday shopping.
- In the first week, traffic increased by 36.4%—improving from the final week of October, which saw a traffic increase of 35.4%.
- Traffic decelerated to 32.2% in the second week of November before accelerating to 36.8% in the third week. In the fourth week, it traffic growth further accelerated to 47.2%.
- Apparel was the strongest performing category in November, witnessing a 57.3% increase in traffic, as shoppers commenced buying for the holiday season and returned to the office. It was 1130 basis points above its October level.
- In November, footwear was the second-strongest category, increasing by 41.9% year-over-year and 900 basis points higher than October. Footwear traffic trends were up in the first and second weeks and peaked in the fourth week, reaching 52.0% growth. This category had the strongest year-over-year growth on Black Friday, with an increase of 86.0%.
- Traffic in the jewelry category increased by 36.9% year-over-year, climbing 1200 basis points above its October level.
- The health and beauty category saw a traffic increase of 33.3% on a year-over-year basis; and increased by 1100 basis points from October. This category had the strongest growth in the fourth week, at 47.3%, influenced by Black Friday’s 70.7% growth.
- The softest growth was seen in the home category, which recorded a 7.9% year-over-year traffic increase.
Figure 2. US Retail Traffic by Industry Vertical: YoY % Change [caption id="attachment_138147" align="aligncenter" width="700"]
RetailNext started providing traffic trends on a year-over-year basis from August 2021. Source: RetailNext [/caption] Regional Traffic Trends Numbers of new Covid-19 cases increased in mid-November and saw an uptick after Thanksgiving. In late October, the Food and Drug Administration (FDA) gave authorization for the Pfizer-BioNTech Covid-19 vaccine to be administered to children aged 5–11 years old. In mid-November the Centers for Disease Control and Prevention (CDC) also authorized the Pfizer-BioNTech and Moderna Covid-19 vaccines to be administered as a third “booster” shot to all US adults. These moves give added protection to children and vaccinated adults, which should boost consumer confidence over the holidays. In early November, the US relaxed its border restrictions, allowing fully vaccinated travellers from 33 nations to enter with no quarantine requirement. However, restrictions were reintroduced on November 27 on travellers from South Africa and seven other southern African countries due to the newly discovered Omicron variant. Omicron was not yet a domestic issue in November—the first US case was reported on December 1. Retail traffic in November varied across regions:
- The Midwest saw the strongest traffic growth in November, as it increased throughout the month and grew 47.7% year over year.
- The West was the second-best performer, with traffic increasing by 40.4% year over year despite underperforming all regions in the first two weeks. Los Angeles began requiring proof of full vaccination to enter restaurants, gyms, shopping malls and other indoor venues on November 4.
- The Northeast saw a 39.9% year-over-year increase in traffic, on a par with the national average. Traffic growth decelerated in the second week to 33.0% but improved for the rest of the month.
- The South saw the weakest traffic growth in November, although it was still strong at 38.0% year over year, and was up from October’s traffic growth of 32.0%.
- Traffic by mall location type increased between 26.3% and 80.9% year over year.
- Other retail locations, including airports, casinos and hotels, outperformed all other location types, with traffic increasing by 80.9% year over year. The rise can be attributed to the relaxing of restrictions, increasing vaccination drives and the holiday season.
- Luxury locations comprised the second-best performer, with traffic increasing by 67.9%, followed by traditional malls, which saw 54.4% year-over-year traffic growth.
- Street-front/freestanding locations saw a traffic increase of 52.8%, while lifestyle centers reported a year-over-year traffic increase of 52.0%.
- Outlets saw growth of 46.6%, while strip malls performed the weakest this month, registering 26.3% growth year over year.