DIpil Das
US
| What’s New? | Trend Data | Positive or Negative* |
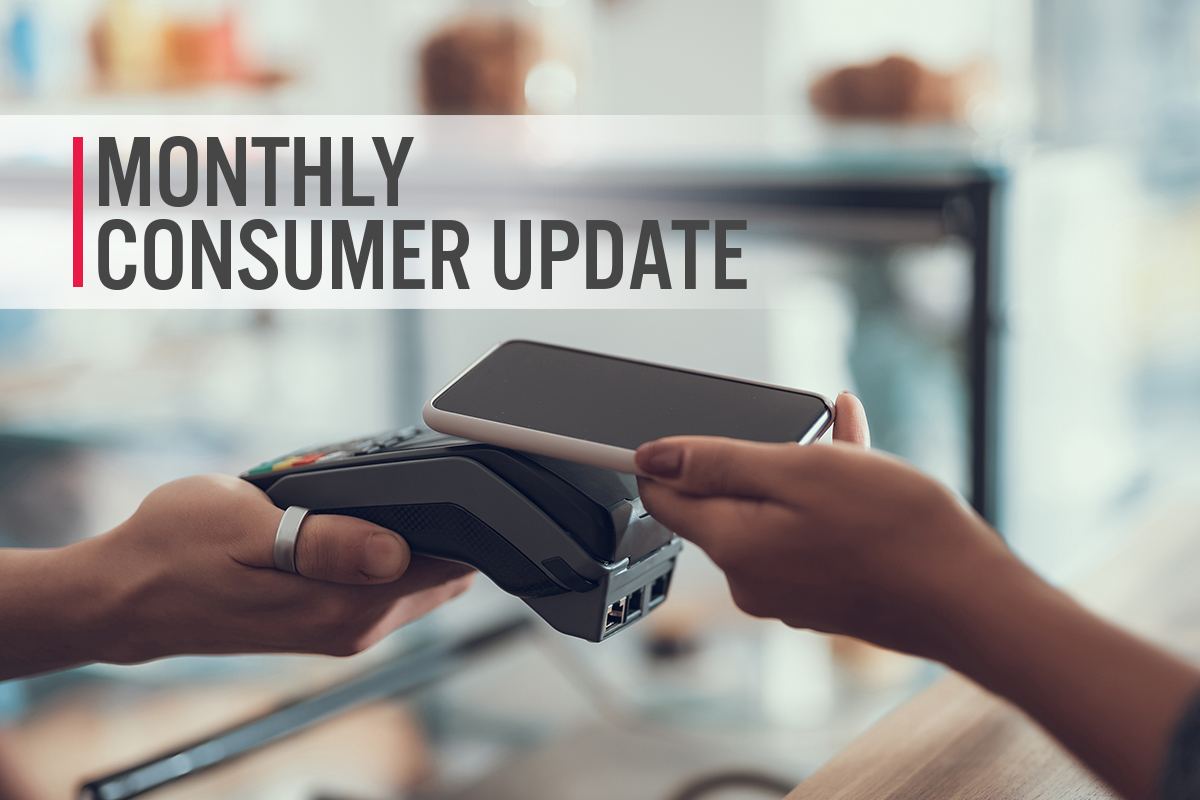
| Earnings vs. Inflation: In the US, seasonally adjusted inflation reached its highest level since 1982 in November. The seasonally adjusted consumer price index rose 6.8% year over year. Inflation remained high, due in part to increases in consumer prices of shelter and used and new vehicles, according to the Bureau of Labor Statistics (BLS). Average weekly earnings growth accelerated slightly in November, increasing by 4.8% year over year. Inflation continued to outpace earnings growth in November, negatively affecting consumer spending power. In November 2021, average hourly earnings continued to rise, this time by $0.07 to $31.03. Average weekly hours ticked up slightly to 34.8, returning to the level seen in September. The seasonally adjusted unemployment rate continued to drop in November. Unemployment fell by 0.4-PPT month over month to 4.2%—well below the 5.0% level that economists typically consider to represent full employment. Job growth was slow in November, as the US added just 210,000 workers in nonfarm payrolls during the month, far below expectations. According to the BLS, notable job gains were seen in the professional and business services, transportation and warehousing, construction, and manufacturing sectors. Retail posted a loss of 20,000 jobs, with the largest losses seen at general merchandise, clothing and accessory, sporting goods, hobby, book and music stores. In the week ended December 18, 2021, approximately 205,000 Americans filed for unemployment benefits—a figure unchanged from the previous week. |
Average Weekly Earnings vs. Consumer Prices: YoY % Change 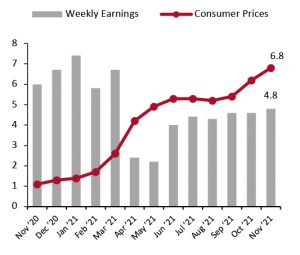 |
|
| Food and Fuel Prices: Food and gas price inflation rates are significant metrics because higher costs in these categories can impact discretionary spending. November saw US food inflation continue to climb, driven by a 20.9% year-on-year increase in beef prices. Gasoline price inflation may have reached a peak in November, growing 58.1% year over year. High rises in gas prices are the result of a rapid recovery in demand and a tightening of global crude supply by the Organization of the Petroleum Exporting Countries (OPEC). On August 11, the office of US President Joe Biden requested that OPEC and its allies boost crude oil production to mitigate rising gasoline prices. Separately, in July, OPEC and its allies agreed to boost crude oil production by 400,000 barrels per day (bpd), starting in August, until bpd reaches pre-pandemic levels—the oil producers are currently supplying 5.8 million bpd fewer than before the crisis. On September 1, OPEC reaffirmed the 400,000 bpd supply boost in a meeting with its allies. On November 23, President Biden announced the administration will utilize the Strategic Petroleum Reserve (SPR). The US intends to release 50 million barrels of oil from the SPR in an attempt to combat the rapid rise in fuel inflation in 2021. |
Consumer Prices for Food at Home and Gasoline: YoY % Change 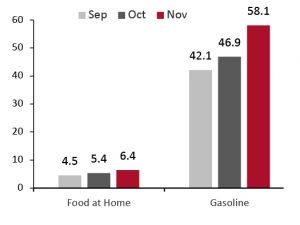 |
|
| Retail Sales: Total US retail sales, excluding gasoline and automobiles, grew by a strong 14.8% year over year and by 24.8% when compared to 2019 values, supporting expectations of a strong US holiday season in 2021. Many sectors saw strong sales growth in November 2021 compared to pre-pandemic November 2019: Sales increased by 38.5% at sporting goods, hobby, musical instrument and book stores, by 47.3% at non-store retailers, by 28.7% at miscellaneous store retailers, and by 15.2% at general merchandise stores. US department store sales continued to recover strongly, posting a 4.9% increase in sales compared to pre-pandemic 2019 values. Clothing and clothing accessory stores continued to see strong two-year growth in the mid-teens, growing 14.4% compared to 2019. |
Total Retail Sales ex. Automobiles and Gasoline: YoY % Change [caption id="attachment_138809" align="aligncenter" width="300"] Data are not seasonally adjusted[/caption] Data are not seasonally adjusted[/caption]
|
UK
| What’s New? | Trend Data | Positive or Negative* |
| Earnings vs. Inflation: In the UK, inflation continued to rise in November. Consumer prices grew 4.6% in November, marking the second consecutive month of accelerating inflation, growing from October’s 3.8% year-over-year rise in consumer prices. Average earnings growth decelerated for the sixth consecutive month in October to 4.2% (latest data), down from September’s 4.7% year-over-year growth. Notably, consumer price increases outpaced average weekly earnings growth in the UK, which will negatively impact consumer spending power. In November 2021, the number of payroll employees increased to 29.4 million, an increase of 257,000 employees in non-farm payrolls from October. Compared to November 2020, the number of payroll employees rose by 1,353,000, a rise of 4.8%. Median monthly pay increased by 4.7% year over year, and by 7.9% when compared to pre-pandemic February 2020. The administrative and support services sector saw the largest gains, adding 290,000 employees, while the transportation and storage sector saw a decline of 9,000 employees in November. |
Average Weekly Earnings vs. Consumer Prices: YoY % Change [caption id="attachment_138810" align="aligncenter" width="300"]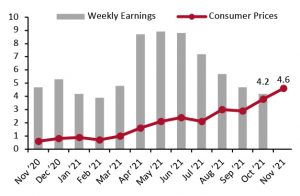 Latest earnings data are for October Latest earnings data are for OctoberSource: ONS[/caption] |
|
| Food and Fuel Prices: Higher costs for food and automotive fuel can impact discretionary spending. In November, UK food price inflation continued its slow acceleration, reaching 2.5% year-over-year growth, up from October’s 1.3%. Automotive fuel price inflation also accelerated. Year over year, automotive fuel prices increased by 28.5%, surpassing October’s 21.5% for the largest year-over-year increase in 2021. |
Consumer Prices for Food at Home and Automotive Fuel: YoY % Change 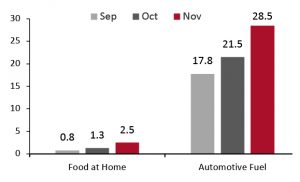 |
|
| Retail Sales: Total UK retail sales growth improved in November, posting a healthy gain of 5.8% compared to 2020, supported by raised inflation: Shop prices were up by 4.4% year over year, the strongest pace of expansion in just over a decade. On a two-year basis (versus pre-pandemic 2019), November retail sales represented the highest two-year growth in decades, growing 13.5%. Clothing specialists’ sales surged compared to November 2020, growing 56.9% year-over-year. Compared to pre-pandemic values, clothing specialists saw sales increase by 6.8%. In November, the complementary footwear sector recovered to surpass pre-pandemic values for the first time—albeit marginally—posting 0.1% two-year growth. Sales at department stores and mixed-goods retailers stayed above pre-pandemic values in November. Department stores sales saw two-year sales growth accelerate to 3.0% in November. Health and beauty sales continued to see strong growth in November. Sales were up by 10.6% compared to two years prior. Health and beauty sales continued to see strong growth in November. Sales were up by 10.6% compared to two years prior. Online sales as a percentage of overall retail continued to grow in November, reaching 30.1%. Despite this, year-over-year online sales growth remained negative, declining by 14.4%. |
Total Retail Sales ex. Automobiles and Automotive Fuel: YoY % Change [caption id="attachment_138812" align="aligncenter" width="300"]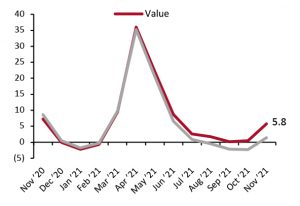 Data are not seasonally adjusted[/caption] Data are not seasonally adjusted[/caption] |
|
China
| What’s New? | Trend Data | Positive or Negative* |
| Income vs. Inflation: In China, the consumer price index grew 2.3% in November, the third consecutive month of modest inflation acceleration, up from October’s 1.4% year-over-year rise in consumer prices. Data on per capita disposable income are released quarterly. In the third quarter of 2021, per capita disposable income grew by a healthy 10.4% year over year, down slightly from 12.6% growth in the second quarter of 2021. The economy’s recovery is being challenged by a struggling real-estate market as the government implements its newest five-year plan, natural disasters from earlier in the year affecting the supply chain, and Covid-19 outbreaks. |
Per Capita Disposable Income vs. Consumer Prices: YoY % Change [caption id="attachment_138813" align="aligncenter" width="300"]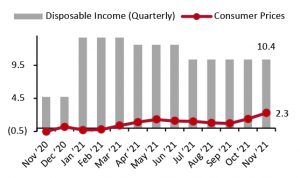 Disposable income data are quarterly[/caption] Disposable income data are quarterly[/caption] |
|
| Food and Fuel Prices: Higher costs for food and automotive fuel can impact discretionary spending. Food prices rose 1.6% in November, a healthy increase after five consecutive months of negative growth. Beijing’s fuel price inflation accelerated in November, increasing to 31.6% compared to November 2020, up from October’s 24.1% year-over-year growth. |
Consumer Prices for Food at Home and Automotive Fuel: YoY % Change 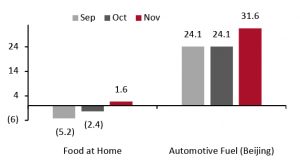 |
|
| Retail Sales: Retail sales growth remained steady in November, growing 4.8% year over year, remaining in line with retail sales growth rates in September and October. Apparel and footwear sales declined, albeit marginally, in November, falling by 0.5% year over year in the fourth consecutive month of negative growth. On a two-year basis, however, apparel and footwear sales saw solid growth of 4.0%. This sector is likely impacted by China’s strict Covid-19 restrictions. Beauty sales continued to gain speed in November, posting 8.2% year-over-year sales growth. On a two-year basis, beauty sales grew by an incredible 72.7%. Sales of school and office supplies saw the strongest growth of any sector in November, growing 18.1% compared to 2020. Compared to 2019, school and office supplies sales rose by 35.0%. The food sector’s strong performance continued in November, accelerating from October’s growth to 14.8% year over year or 19.0% on a two-year basis. Online retail sales accounted for a substantial 36.5% of all retail sales in November, the highest level of online sales penetration in 2021. In November specifically, online sales penetration was likely boosted by the Singles’ Day shopping festival, also known as 11.11, the world’s largest online shopping event, hosted by e-commerce giants Alibaba and JD.com. |
Total Retail Sales incl. Automobiles and Gasoline: YoY % Change [caption id="attachment_138815" align="aligncenter" width="300"]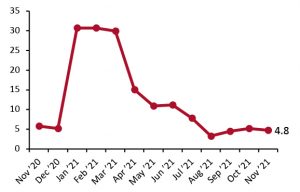 From December 2020, our China retail sales index excludes food-service sales; data in prior reports included food-service sales. Data for January and February 2021 are aggregated.[/caption] From December 2020, our China retail sales index excludes food-service sales; data in prior reports included food-service sales. Data for January and February 2021 are aggregated.[/caption] |