DIpil Das
What’s the Story?
In our Leading Indicators of US Retail Sales monthly series, we examine several key macroeconomic indicators of US retail sales and analyze how they may impact the industry in the months to come. We analyze the latest available data, as of the end of November 2021, from sources such as the US Census Bureau, the US Bureau of Economic Analysts (BEA), the US Bureau of Labor Statistics (BLS) and the US Department of Housing and Urban Development (HUD).Why It Matters
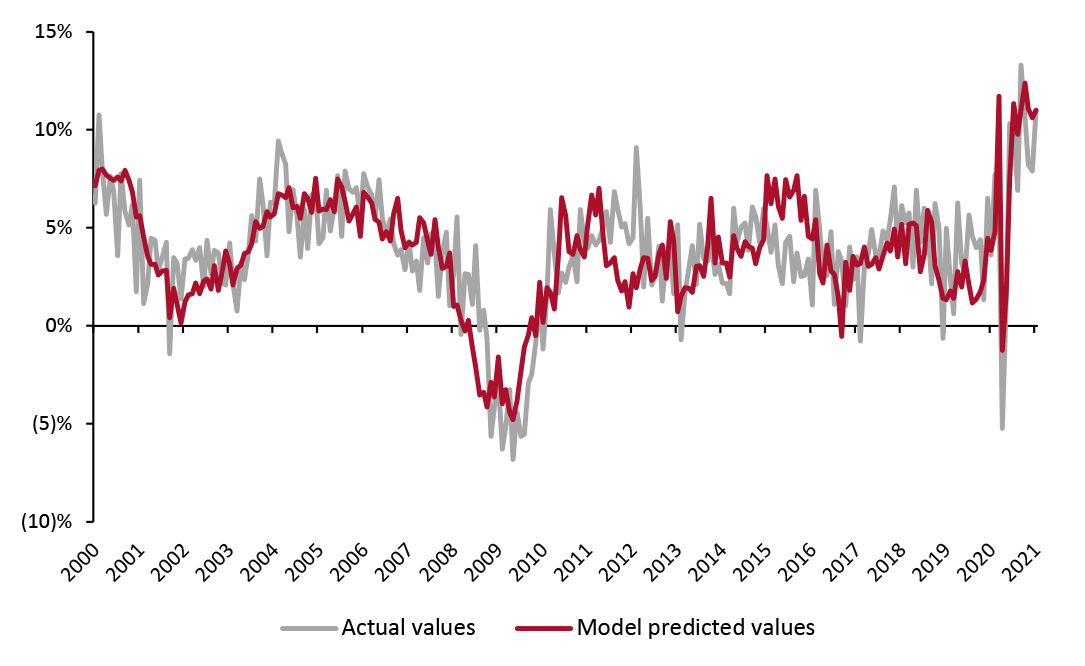
Macroeconomic indicators have a significant impact on overall retail sales growth. Looking at 10 indicators (unemployment rate, labor force participation rate, disposable income per capita, average hourly wages, consumer sentiment, saving rate, gas price, federal funds rate, housing starts and housing prices), we can historically account for a majority of the variation in retail sales growth and create a strong basis for predicting sales moving forward. The close correlation between retail sales growth predictions based on economic indicators and actual retail sales growth is shown in Figure 1.Figure 1. US Actual Retail Sales ex. Auto and Gas Sales vs. Model Predicted Sales, January 2000–January 2021 (YoY % Change) [caption id="attachment_137935" align="aligncenter" width="701"]
 Source: BEA/BLS/Federal Reserve Board of Governors/S&P/Coresight Research[/caption]
In October, retail sales growth remained strong and in line with September at 10.8%. October retail sales growth was likely boosted by an earlier than usual start to the holiday season amid concerns over delivery delays and out-of-stock supplies in the current supply chain situation. In November, we predict that retail sales will grow 8.4% year over year, slightly slower than October’s 10.8% year-over-year increase.
Source: BEA/BLS/Federal Reserve Board of Governors/S&P/Coresight Research[/caption]
In October, retail sales growth remained strong and in line with September at 10.8%. October retail sales growth was likely boosted by an earlier than usual start to the holiday season amid concerns over delivery delays and out-of-stock supplies in the current supply chain situation. In November, we predict that retail sales will grow 8.4% year over year, slightly slower than October’s 10.8% year-over-year increase.
Leading Indicators of US Retail Sales: In Detail
Indicators Overview Of the 10 indicators we examined, six are likely to have a positive impact on retail sales in the coming months. In November, the unemployment rate continued to fall while the labor force participation rate increased for the first time in two months. Disposable income and wages increased month over month. Consumer sentiment continued to decline in November’s preliminary figures. Gas prices declined slightly as of early December, following President Biden’s announcement that the US will use the Strategic Petroleum Reserve to release more oil into the economy—nevertheless, gas prices remain high. Housing prices continued to rise.Figure 2. US: Leading Indicators of Retail Sales, as of the End of July 2021 [caption id="attachment_137936" align="aligncenter" width="700"]
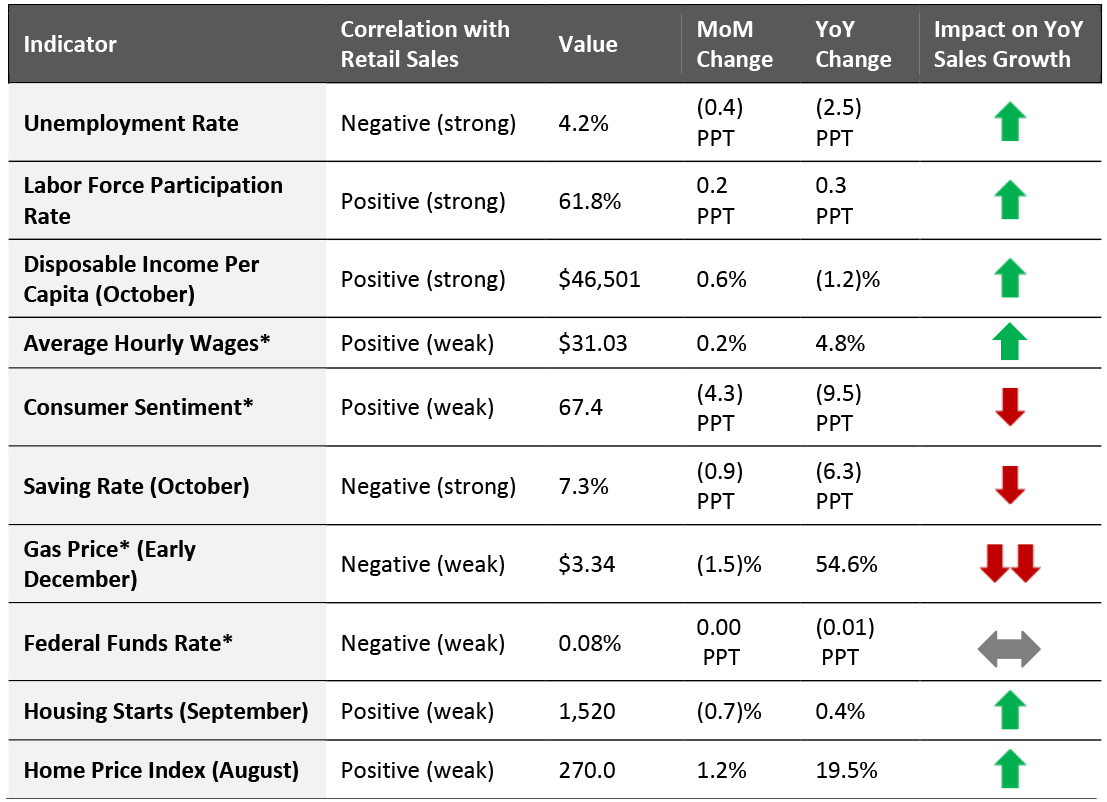 Latest available data from November unless otherwise indicated
 *Not included in predictive model
Source: BEA/BLS/Federal Reserve Board of Governors/S&P/University of Michigan/US Energy Information Administration/Coresight Research [/caption] Looking ahead to soon-to-be-reported November retail sales (at the time of publication), our model projects retail sales to increase 8.4% year over year, as illustrated in Figure 3. This is roughly one-third of the growth experienced in April and is in line with previous growth trends in the second half of 2020.
Figure 3. US Retail Sales ex. Auto and Gas (YoY % Change) [caption id="attachment_137937" align="aligncenter" width="699"]
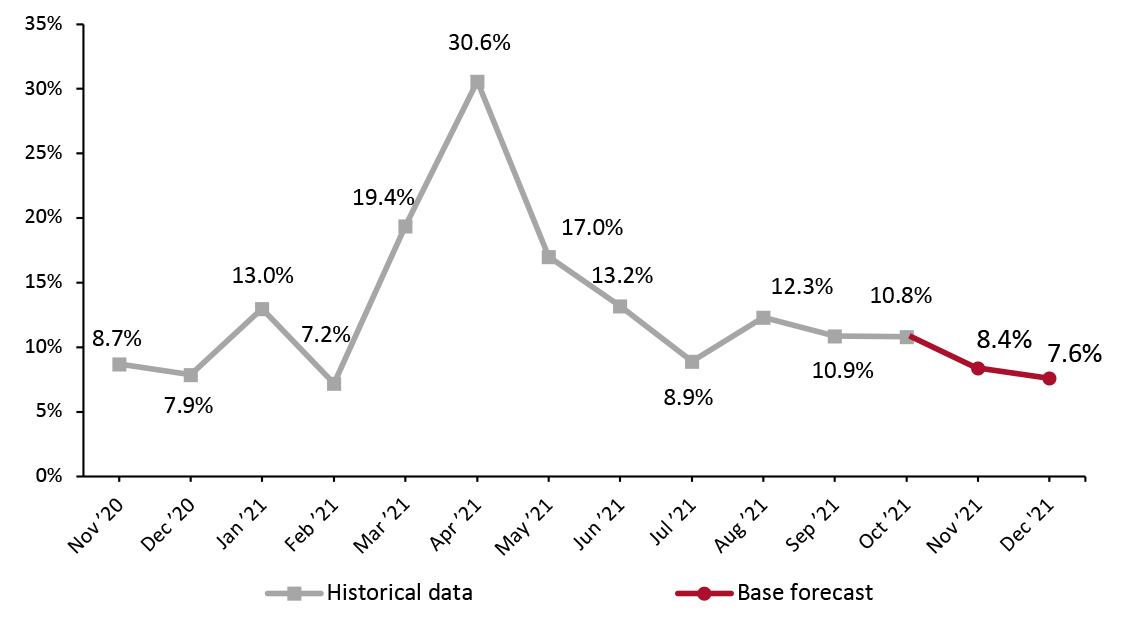 Source: BEA/BLS/Federal Reserve Board of Governors/S&P/Coresight Research[/caption]
The Job Market
In November, the US economy created far fewer jobs than expected, adding only 210,000 workers in nonfarm payrolls. The stall in job growth likely reflects the continued adversity employers face in hiring new workers, as new Covid-19 infections have again increased. Job growth was led by the professional and business services and transportation and warehousing sectors. Retail posted a loss of 20,000 jobs, despite being in peak holiday season. Within retail, general merchandise stores, clothing and accessory stores, and sporting goods, hobby, book, and music stores lost the most. Retail employment remains 176,000 jobs lower than its pre-pandemic February 2020 value. The rise in new Covid-19 cases and discovery of the new, highly transmissible Omicron variant may pose challenges to hiring for retailers in the coming months, as public health concerns are elevated.
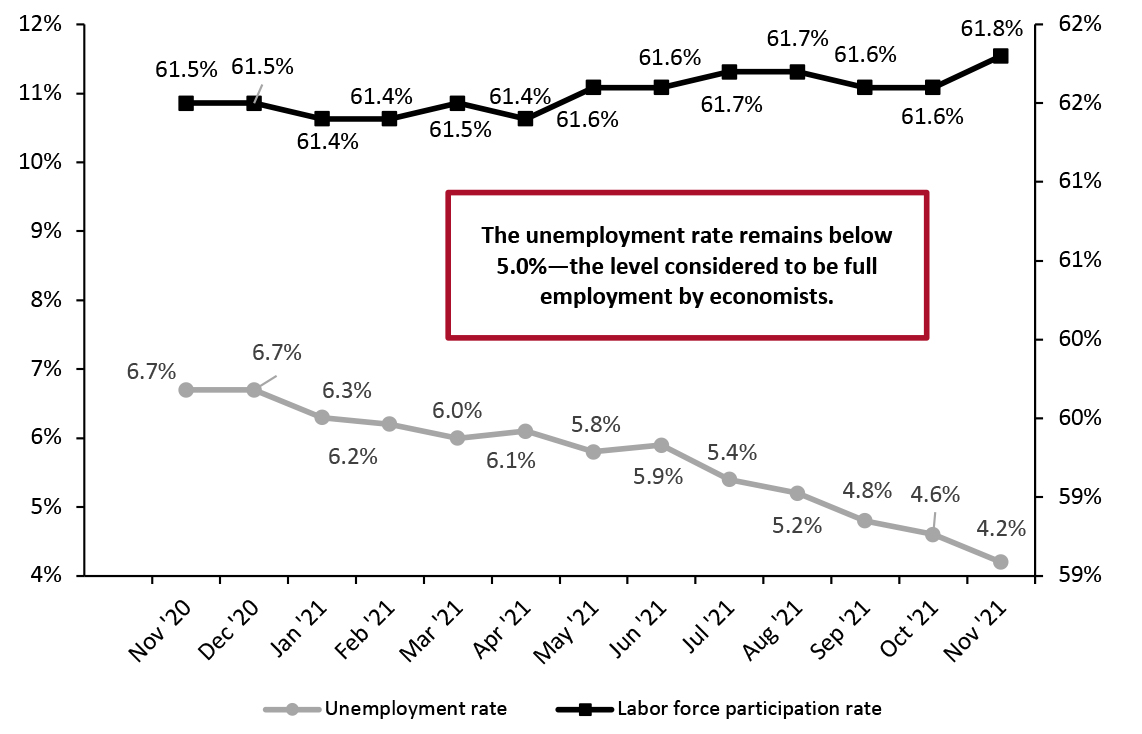
The unemployment rate continued to fall in November to 4.2%, well below the 5.0% level economists consider to be full employment. Hiring is strong owing to a high demand for goods and services during pandemic recovery. Notably, the unemployment rate dropped as the labor force participation rate slightly increased by 0.2% to 61.8%. Decreases in the unemployment rate, paralleled by increases in the labor force participation rate, reflect the continued strong demand for workers and a persistently tight labor market. The labor force participation remains 1.5% lower than its pre-pandemic February 2020 value. Furthermore, in October (latest available data according to Job Opening and Labor Turnover) turnover remained high as 4.2 million workers quit their jobs—although this was down from the record-high 4.4 million resignations in September.
Source: BEA/BLS/Federal Reserve Board of Governors/S&P/Coresight Research[/caption]
The Job Market
In November, the US economy created far fewer jobs than expected, adding only 210,000 workers in nonfarm payrolls. The stall in job growth likely reflects the continued adversity employers face in hiring new workers, as new Covid-19 infections have again increased. Job growth was led by the professional and business services and transportation and warehousing sectors. Retail posted a loss of 20,000 jobs, despite being in peak holiday season. Within retail, general merchandise stores, clothing and accessory stores, and sporting goods, hobby, book, and music stores lost the most. Retail employment remains 176,000 jobs lower than its pre-pandemic February 2020 value. The rise in new Covid-19 cases and discovery of the new, highly transmissible Omicron variant may pose challenges to hiring for retailers in the coming months, as public health concerns are elevated.
The unemployment rate continued to fall in November to 4.2%, well below the 5.0% level economists consider to be full employment. Hiring is strong owing to a high demand for goods and services during pandemic recovery. Notably, the unemployment rate dropped as the labor force participation rate slightly increased by 0.2% to 61.8%. Decreases in the unemployment rate, paralleled by increases in the labor force participation rate, reflect the continued strong demand for workers and a persistently tight labor market. The labor force participation remains 1.5% lower than its pre-pandemic February 2020 value. Furthermore, in October (latest available data according to Job Opening and Labor Turnover) turnover remained high as 4.2 million workers quit their jobs—although this was down from the record-high 4.4 million resignations in September.
Figure 4. US Unemployment Rate (Left Axis, %) and Labor Force Participation Rate (Right Axis, %) [caption id="attachment_137938" align="aligncenter" width="700"]
 Source: BLS[/caption]
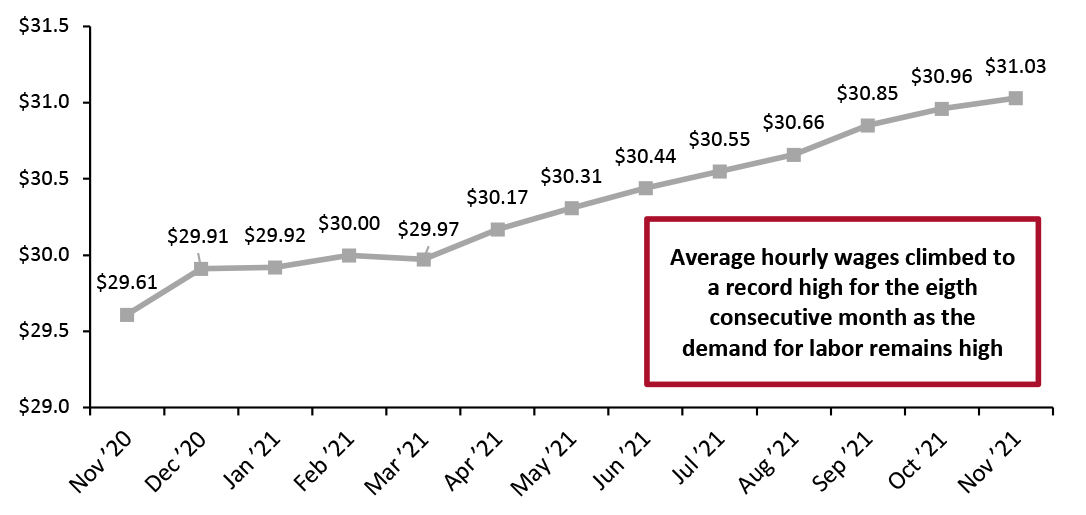
The highs in average hourly wages in the private sector continued in November, setting a new record for the eighth consecutive month of $31.03 per hour. While the month-over-month increase of $0.07 per hour is small in dollar terms, it is a meaningful figure considering the sheer scale of the US workforce. With workers in high demand, an increase in hourly wages is one method employers are using to draw more workers back into the labor force. Workers continue to have the upper hand to demand better pay and working conditions in a tight labor market.
Source: BLS[/caption]
The highs in average hourly wages in the private sector continued in November, setting a new record for the eighth consecutive month of $31.03 per hour. While the month-over-month increase of $0.07 per hour is small in dollar terms, it is a meaningful figure considering the sheer scale of the US workforce. With workers in high demand, an increase in hourly wages is one method employers are using to draw more workers back into the labor force. Workers continue to have the upper hand to demand better pay and working conditions in a tight labor market.
Figure 5. US Average Hourly Wages, All Private-Sector Employees (USD) [caption id="attachment_137939" align="aligncenter" width="700"]
 Source: BLS[/caption]
Implications
Despite an increase in the labor force participation rate this month, the unemployment rate continued to decline as the numbers of new job openings outpace the number of available workers. The tight labor market poses challenges for retail specifically, as the sector posted negative job growth in November, during its peak holiday season. The current worker shortage may mean longer checkout lines, less organized stores and reduced holiday store hours.
Income, Savings and Sentiment
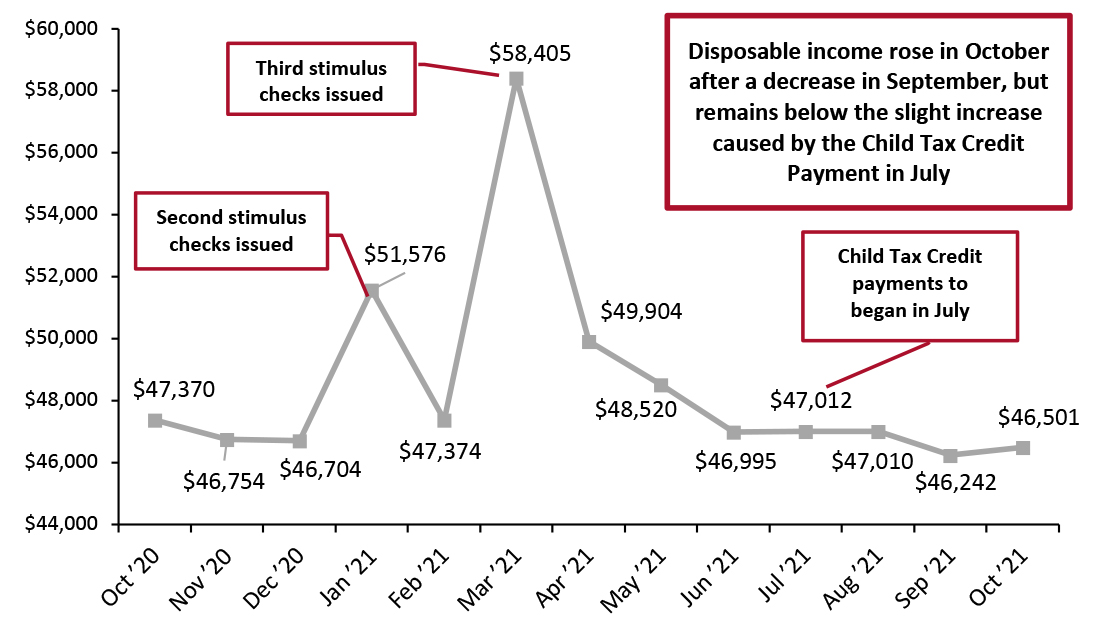
Real disposable income per capita has fallen substantially since the stimulus-driven spike in March. Despite a slight uptick in July due to the beginning of Child Tax Credit payments, real disposable income has seen slight fluctuations in recent months. In October (latest available data) real disposable income rose from September’s value to $46,501.
Source: BLS[/caption]
Implications
Despite an increase in the labor force participation rate this month, the unemployment rate continued to decline as the numbers of new job openings outpace the number of available workers. The tight labor market poses challenges for retail specifically, as the sector posted negative job growth in November, during its peak holiday season. The current worker shortage may mean longer checkout lines, less organized stores and reduced holiday store hours.
Income, Savings and Sentiment
Real disposable income per capita has fallen substantially since the stimulus-driven spike in March. Despite a slight uptick in July due to the beginning of Child Tax Credit payments, real disposable income has seen slight fluctuations in recent months. In October (latest available data) real disposable income rose from September’s value to $46,501.
Figure 6. US Annualized Real Disposable Income Per Capita (USD) [caption id="attachment_137940" align="aligncenter" width="700"]
 Source: BEA[/caption]
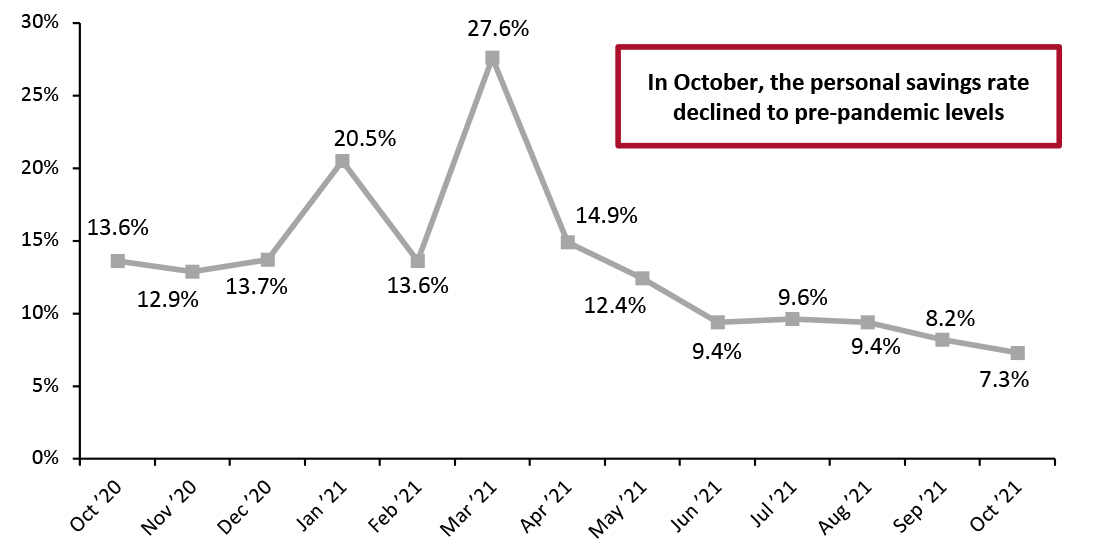
The personal saving rate has substantially declined since the third round of stimulus checks in March. July saw a small uptick likely due to the beginning of Child Tax Credit payments. Since then, the savings rate has steadily declined, retuning to pre-pandemic values. In October (latest available data) the personal savings rate fell for the third consecutive month to 7.3%, in line with the 7.4% savings rate consumers exhibited in pre-pandemic October 2019. Consumers’ excess savings during the pandemic appear to be dwindling largely due to the expiration of government assistance such as stimulus payments and supplemental unemployment benefits.
Source: BEA[/caption]
The personal saving rate has substantially declined since the third round of stimulus checks in March. July saw a small uptick likely due to the beginning of Child Tax Credit payments. Since then, the savings rate has steadily declined, retuning to pre-pandemic values. In October (latest available data) the personal savings rate fell for the third consecutive month to 7.3%, in line with the 7.4% savings rate consumers exhibited in pre-pandemic October 2019. Consumers’ excess savings during the pandemic appear to be dwindling largely due to the expiration of government assistance such as stimulus payments and supplemental unemployment benefits.
Figure 7. Personal Saving Rate (%) [caption id="attachment_137941" align="aligncenter" width="701"]
 Source: BEA[/caption]
Consumer confidence continued to decline in November, hitting a 10-year low of 66.8 in early November—however, at the end of the month, the preliminary November consumer sentiment figure marginally improved to a still-low 67.4. Declining consumer sentiment is related to high inflation and supply chain concerns. In November, US inflation hit a 39-year high as consumer prices rose 6.8% from November 2020.
Source: BEA[/caption]
Consumer confidence continued to decline in November, hitting a 10-year low of 66.8 in early November—however, at the end of the month, the preliminary November consumer sentiment figure marginally improved to a still-low 67.4. Declining consumer sentiment is related to high inflation and supply chain concerns. In November, US inflation hit a 39-year high as consumer prices rose 6.8% from November 2020.
Figure 8. University of Michigan Consumer Sentiment Index [caption id="attachment_137942" align="aligncenter" width="701"]
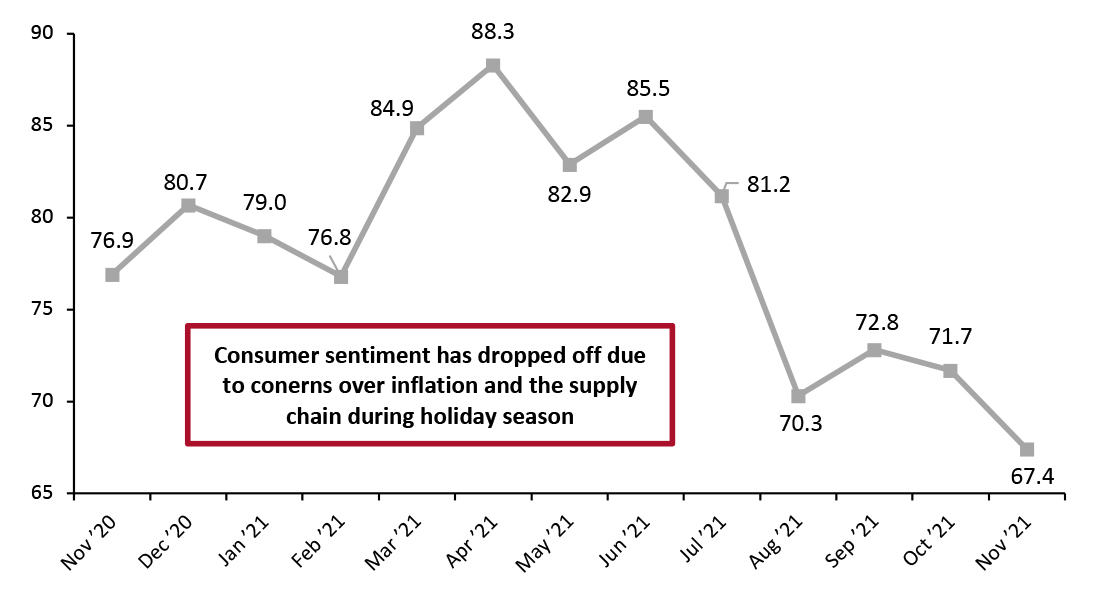 Note: November 2021 figure is preliminary
 Source: University of Michigan [/caption] Gas prices rose dramatically in November, reaching $3.39 per gallon. On November 23, President Biden announced that his administration will utilize the Strategic Petroleum Reserve (SPR) to release fifty million barrels of oil to combat fuel inflation. Consequently, gas prices fell back slightly as of early December to $3.34, but remain high.
Figure 9. US Regular All Formulations Gas Price (Dollars per Gallon) [caption id="attachment_137943" align="aligncenter" width="700"]
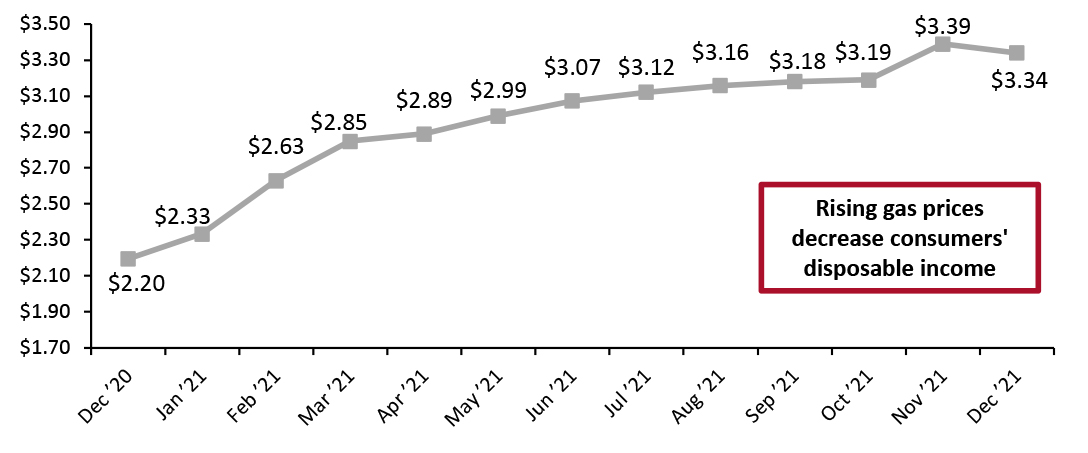 Source: US Energy Information Administration[/caption]
Implications
Higher gasoline prices have a multiplier effect throughout the entire economy, impacting the price of goods delivery as well as personal travel. Increased gas prices are likely contributing to consumer expectations of higher inflation, as the cost of filling up their gas tanks increases. They also reduce consumer disposable income, hitting lower-income consumers harder—as many need to drive to work and the cost of fuel represents a higher percentage of their income.
Housing
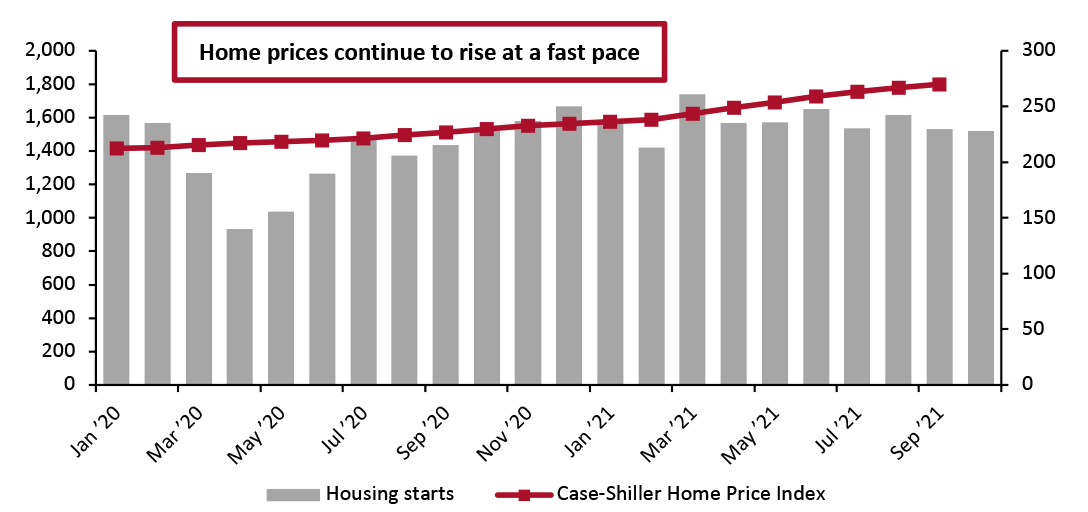
Housing starts marginally declined in October (latest available data), decreasing by 0.7% month over month—representing the third consecutive month of declines. There were 1.5 million new housing starts in October.
Home prices continued to climb in September (the latest month for which Case-Shiller Index data is available), reaching 270.0 points, up from 266.9 in September. Rising home prices can create a wealth effect, making consumers feel more affluent and emboldening them to spend.
Source: US Energy Information Administration[/caption]
Implications
Higher gasoline prices have a multiplier effect throughout the entire economy, impacting the price of goods delivery as well as personal travel. Increased gas prices are likely contributing to consumer expectations of higher inflation, as the cost of filling up their gas tanks increases. They also reduce consumer disposable income, hitting lower-income consumers harder—as many need to drive to work and the cost of fuel represents a higher percentage of their income.
Housing
Housing starts marginally declined in October (latest available data), decreasing by 0.7% month over month—representing the third consecutive month of declines. There were 1.5 million new housing starts in October.
Home prices continued to climb in September (the latest month for which Case-Shiller Index data is available), reaching 270.0 points, up from 266.9 in September. Rising home prices can create a wealth effect, making consumers feel more affluent and emboldening them to spend.
Figure 10. Housing Starts (Thousands, Left Axis) and Case-Shiller US Home Price Index (Right Axis) [caption id="attachment_137944" align="aligncenter" width="700"]
 Source: HUD/US Census Bureau[/caption]
While the rise in housing prices causes some consumers to feel more affluent, it also means many are forced to rent rather than buy—which may be the reason we have observed three consecutive month-over-month declines in housing starts.
Implications
The strength of the housing market, and especially house prices, remains another positive for retail. House-moves will continue to benefit furniture, furnishings, home-improvement and appliance retailers while the wealth effect from rising prices will trickle down to many discretionary sectors, including big-ticket sectors such as electronics—that wealth effect comes on top of substantially increase consumer savings (from stimulus measures and reduced spending in 2020) and will help prompt consumers to release some of those savings.
Source: HUD/US Census Bureau[/caption]
While the rise in housing prices causes some consumers to feel more affluent, it also means many are forced to rent rather than buy—which may be the reason we have observed three consecutive month-over-month declines in housing starts.
Implications
The strength of the housing market, and especially house prices, remains another positive for retail. House-moves will continue to benefit furniture, furnishings, home-improvement and appliance retailers while the wealth effect from rising prices will trickle down to many discretionary sectors, including big-ticket sectors such as electronics—that wealth effect comes on top of substantially increase consumer savings (from stimulus measures and reduced spending in 2020) and will help prompt consumers to release some of those savings.
What We Think
October retail sales were boosted by an earlier than usual star to this year’s holiday season—which may imply holiday purchases will be drawn out over a longer stretch of time than in the past, instead of being largely concentrated in November and December. Hence, we expect that retail sales growth in November will be slower than October’s 10.8% year-over-year growth, but remain healthy in the upper single digits at 8.4%. Our model projects a further slight slowing in December, but to a still-respectable 7.6% rate. Implications for Brands/Retailers- The discovery of the new highly transmissible Omicron variant poses a hiring challenge for retailers. The retail sector posted job losses during its peak holiday season, reflecting workers’ increased public health concerns of working an in-person job. The shortage of available workers may mean longer checkout lines, less organized stores and shorter store hours as we come down the home stretch of the holiday season.
- Consumer sentiment hit a 10-year low in November as consumers are concerned about record-high inflation impacting their ability to spend on gifts this holiday season. Furthermore, consumers are concerned about delivery delays and out-of-stock products amid supply chain challenges. Consumer sentiment may be further hindered by news of the Omicron variant, as the vaccine’s effectiveness and the severity of illness remain uncertain.