albert Chan
The Coresight Research US Retail Traffic and In-Store Metrics series reviews year-over-year changes in selected store-based metrics as reported by RetailNext. In this month’s report, we review store traffic changes through November, when many states reinstituted stay at home orders and travel restrictions owing to a spike in Covid-19 cases. RetailNext’s coverage does not include food retailers but does include some other retail sectors deemed essential; the exclusion of food retail means that the figures cited below almost certainly overstate recent declines in total retail traffic.
These traffic trends support Coresight Research’s expectations for a sustained, strong increase in e-commerce, as we discuss further in a separate report.
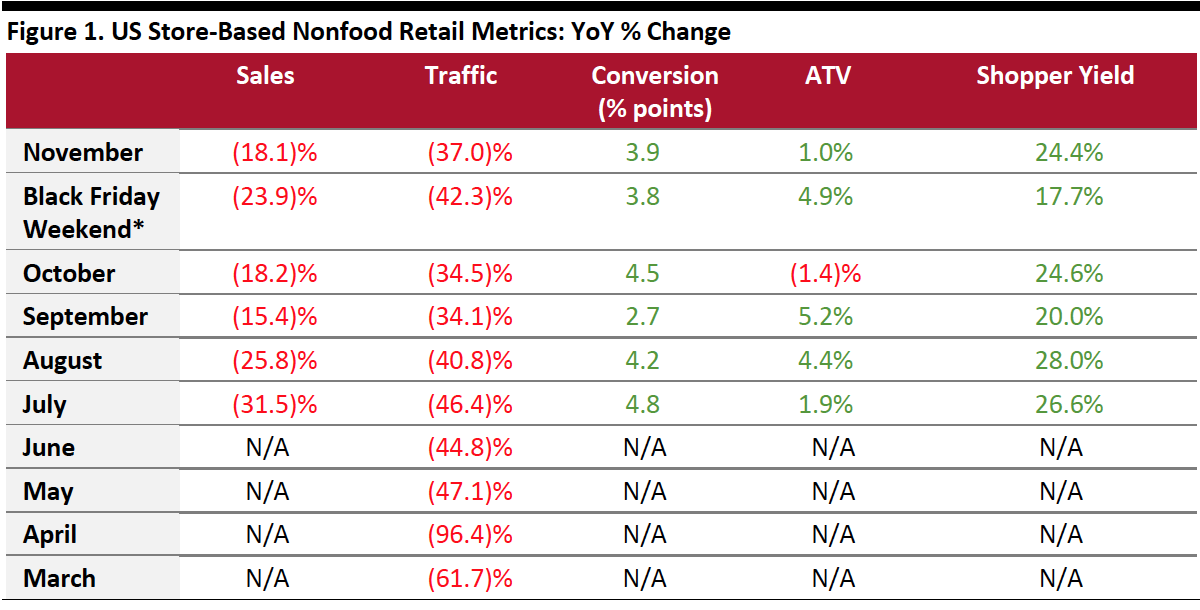
- November saw traffic trends weaken after a recent stabilization: Total US nonfood traffic declined by 37.0% year over year in November, versus October’s 34.5% decline and a roughly similar decline in September. Black Friday weekend underperformed, with a decline of 42.3%.
- The conversion rate (sales transactions as a percentage of traffic) grew by 3.9 percentage points in November, with 3.8-percentage-point growth on the Black Friday weekend, versus October’s 4.5-percentage-point growth.
- In November, ATV (sales divided by transactions) increased by 1.0%, versus October’s 1.4% decline. On the Black Friday weekend, ATV witnessed a greater increase of 4.9%.
- Shopper yield (sales divided by traffic) grew 24.4% in November and 17.7% on Black Friday weekend, versus October’s 24.6% increase. This reflects the pandemic-driven trend of shoppers typically buying more per trip, as they make fewer visits to stores.
 ATV=average transaction value; % Return=percentage of goods returned to stores
*Black Friday weekend comprises November 27–29
Source: RetailNext[/caption]
Weekly Shopper Traffic Trends
Weekly data for November tracks the progress of store reopenings over four weeks (November 1–November 28, 2020):
- Traffic declined by 37.6% in the first week, a slight acceleration in decline from the final week of October, which saw a traffic decline of 36.7%. However, traffic declines eased to 32.2% in the second week of November. Fear of inventory sell-out, safety concerns around overcrowding at stores and shipping deadlines helped drive consumers to shop earlier in the month.
- Declines eased further to 31.3% in the third week of November before accelerating to 41.3% in the fourth week, due to a surge in Covid-19 cases. Early shopping, promotions and advice against holiday travel negatively impacted traffic during Black Friday weekend. Black Friday (November 27) witnessed the worst traffic decline, at 48.0%.
Traffic by Retailer Vertical
While nonessential retailers were severely impacted in March and April by temporary store closures due to Covid-19 lockdowns, traffic improved between May and September, with most states authorizing retailers to reopen physical stores in stages. However, traffic trends slowed slightly in October. In November, traffic trends slowed further: Nonessential retailers experienced an aggregate 37.0% decline in shopper traffic versus October’s 34.5% decline.
Performances varied across industry verticals in November:
- The apparel sector experienced the greatest traffic decline at 37.7%, followed by the jewelry sector, which saw a 37.1% decrease in traffic.
- The home sector posted the lowest decline in traffic, at 29.7%.
- The footwear sector reported a traffic decline of 36.2%.
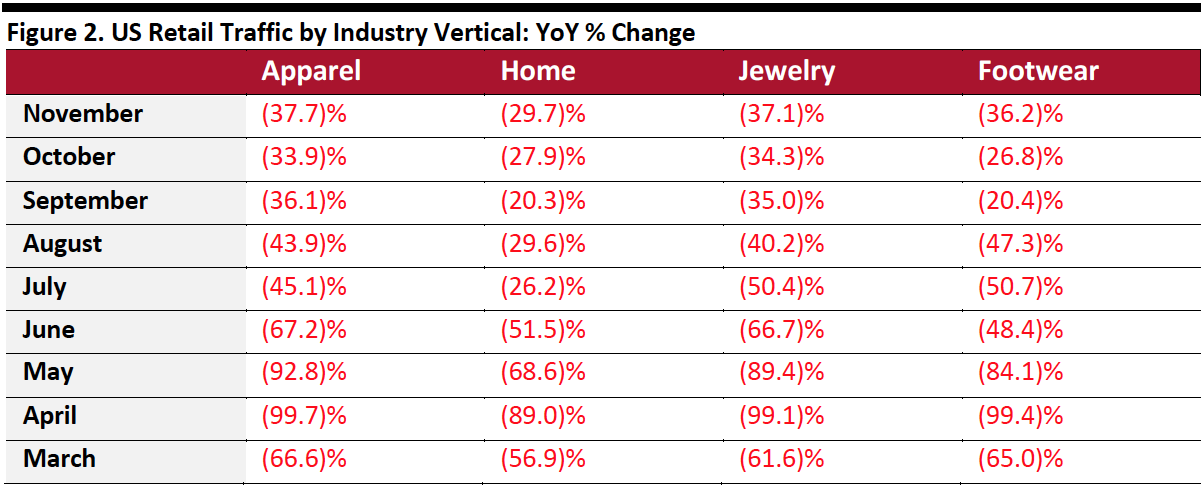 Source: RetailNext[/caption]
Regional Traffic Trends
November witnessed a record rise in Covid-19 cases in several regions, likely driven by asymptomatic people gathering indoors. Many states are heading toward shutdowns as they enter the December holiday season. In November, the Midwest reported the highest number of Covid-19 cases, and hospitalizations continued to surge in the region. The South has been hit hard as Florida recently surpassed 1 million coronavirus cases and Texas saw cases rise to more than 1.2 million. Some states in the Northeast region, such as New York City, Philadelphia and Boston, have reverted to online learning and put in place stay-at-home mandates. In the Western region, certain counties in California, such as Los Angeles and Santa Clara, have reinstituted travel restrictions and stay-at-home orders.
Retail traffic in November varied across regions:
- The Midwest saw the greatest traffic decline of 40.2%. November started out strong, with traffic trends improving by 10 percentage points from Week 1 to Week 2, driven by improvement in traffic in Kansas, Michigan and Missouri, but the trends deteriorated in the third and fourth weeks, which saw traffic declines of 36.5% and 40.5%, respectively. Black Friday weekend saw a greater traffic decline of 42.2%.
- The South posted the lowest decline in traffic, at 34.1%, outperforming other regions every week in November, except the second, probably due to impacts from storms during that week. This region outperformed other regions during Black Friday weekend by five percentage points, with a decline of 36.9%.
- The West was the second-best-performing region, posting a traffic decline of 36.9%. This region also had the second-best trends in Weeks 1–3. However, the fourth week saw a sharp decline of 13 percentage points from Week 3, as restrictive mandates were put in place throughout California. This region saw the largest decline in traffic on the Black Friday weekend, of 46.0%.
- The Northeast posted a traffic decline of 39.6%. The traffic trends deteriorated in the first week of November versus the last week of October as more people stayed home with tighter restrictions in place. The trends improved in the second and third weeks of November, but Week 4 witnessed major deterioration, with a traffic decline of 43.1%, due to new restrictive mandates in place. The traffic trends worsened during the Black Friday Weekend, with a decline of 44.1%.
Traffic by Retailer Location Type
In November, mall traffic outperformed non-mall traffic, declining by 37.6% compared to the non-mall traffic decline of 40.9%. However, during the Black Friday weekend, non-malls outperformed malls as many shoppers appeared to try to avoid mall crowds. Mall traffic was comparatively consistent across different location types. Non-enclosed storefront locations continued to perform better than traditional enclosed shopping centers.
- Traffic by mall location type declined by 23% and 55%, with strip malls outperforming other location types by more than 10 percentage points, with a decline of only 23.5%; these benefited from being open-air centers and the presence of nondiscretionary retailers such as food retailers.
- Lifestyle center, outlet and traditional mall locations witnessed traffic declines of between 40% and 43%. Street-front and freestanding locations witnessed a decline of 34.7%, while luxury locations performed 10 percentage points below the national average, with a decline of 47.9%.
- Other retail locations including airports, casinos and hotels were hit the hardest, with traffic declines of more than 50%, owing to travel restrictions as well as consumer preference to avoid travel.