Source: Company reports/Fung Global Retail & Technology
Fiscal 4Q17 Results
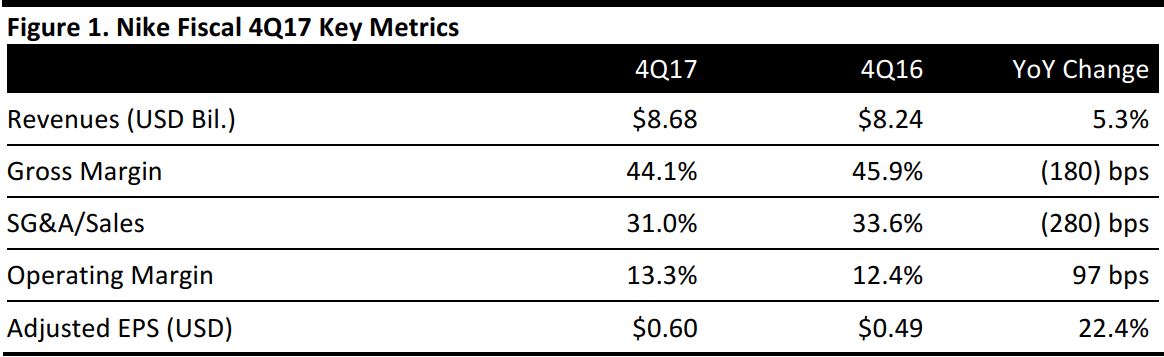
Nike reported fiscal 4Q17 revenues of $8.68 billion, up 5.3% year over year (up 7% in constant currency) and slightly ahead of the $8.63 billion consensus estimate. Revenues for the Nike brand were $8.1 billion, up 7% in constant currency, driven by double-digit growth in Western Europe, Greater China and the emerging markets region as well as by strength in the sportswear and running categories. Converse brand revenues were $554 million, up 10% on a constant-currency basis, driven by growth in direct-to-consumer businesses.
The company’s gross margin declined by 180 basis points year over year, as higher average selling prices were more than offset by unfavorable changes in foreign currency exchange rates and higher product costs.
Nike reported fiscal 4Q17 adjusted EPS of $0.60, ahead of the $0.50 consensus estimate and up 22.4% year over year, driven by SG&A expense leverage as well as by higher global revenue, a lower tax rate and a lower share count.
Results by Product Category
Globally, footwear sales for the Nike brand increased by 10% (excluding currency effects), to $5.08 billion. Apparel sales increased by 4% in constant currency, to $2.24 billion, and equipment sales decreased by 14% in constant currency, to $391 million.
- Footwear: Sales of footwear increased by 8%, or by 10% excluding currency effects. The strongest footwear sales came from the emerging markets region, which saw sales growth of 24% excluding currency effects, followed by Greater China at 18% and Western Europe at 11%.
- Apparel: Global apparel sales increased by 3%, or by 4% excluding currency effects. The strongest regions for apparel growth were Western Europe, where sales increased by 15% excluding currency effects, and Greater China and Japan, where sales were up 14% and 11%, respectively.
- Equipment: Equipment is the company’s smallest segment, and sales in the category declined by 14% in the quarter. The strongest region for equipment sales growth was Central and Eastern Europe, where sales were up 11% excluding currency effects. Sales in the category also increased in Western Europe, where they were up 1% excluding currency effects.Equipment sales declined in North America, Greater China, Japan and the emerging markets region in the quarter.
Results by Geographic Region
In the quarter, revenues increased by 1% in North America (to $3.75 billion), by 12% in Western Europe (to $1.56 billion), by 16% in Greater China (to $1.08 billion), by 6% in Central and Eastern Europe (to $357 million), by 5% in Japan (to $295 million) and by 18% in the emerging markets region (to $1.05 million).
FY17 Results
For the full fiscal year, total revenues rose by 6%, to $34.4 billion from $32.38 billion in the prior year;revenues were up 8% in constant currency. Revenues for the Nike brand were $32.2 billion, up 8% year over year. Nike brand sales to wholesale customers increased by 5%. Direct-to-consumer Nike brand revenues were up 18%, to $9.1 billion, driven by a 30% increase in digital commerce sales, the addition of new stores and 7% growth in comp store sales. The Nike brand had 985 direct-to-consumer stores in operation at the end of the period, compared with 919 stores in the year-ago period.
Nike brand sales were driven by growth in every geography as well as by key categories, including sportswear, running and the Jordan brand. Converse brand revenues were $2.0 billion, up 6%, driven by growth in the US and Europe.
FY17 EPS was $2.51, up 16% and above the $2.41 consensus estimate, driven by SG&A expense leverage as well as by higher global revenue, a lower tax rate and a lower share count, which were slightly offset by a decline in gross margin.
FY18 Outlook
The company did not provide a FY18 outlook. The consensus calls for revenues of $36.39 billion, implying revenue growth of 5.8%. Consensus expects FY18 EPS of $2.47, implying a 1.6% decline from $2.51 in FY17.
