Source: Company reports
4Q16 RESULTS
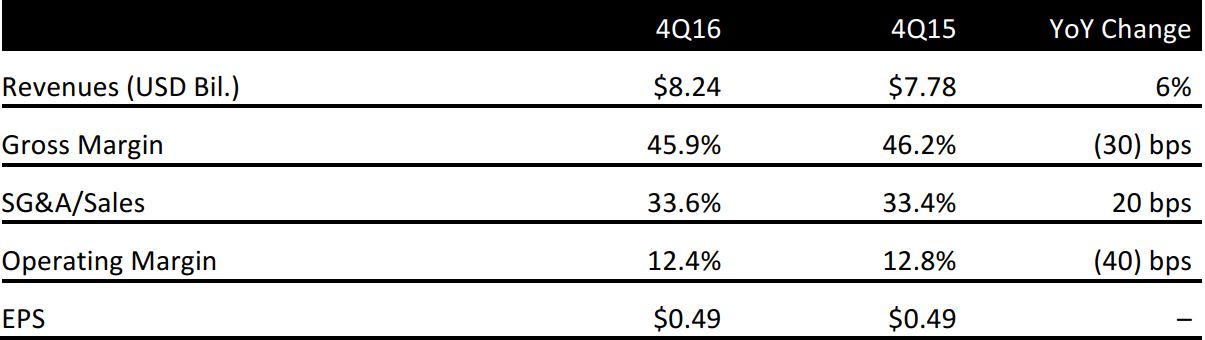
Nike reported fiscal 4Q16 EPS of $0.49, above the consensus estimate of $0.48.
Total revenue was $8.24 billion, below consensus of $8.28 billion. By geography, North America sales were $3.73 billion versus consensus of $4.01 billion; Western Europe sales were $1.50 billion versus consensus of $1.35 billion; Central and Eastern Europe sales were $345 million versus consensus of $373.2 million; Greater China sales were $979 million versus consensus of $967.9 million; Japan sales were $280 million versus consensus of $259.8 million; and emerging market sales were $872 million versus consensus of $875.5 million.
Revenues for the Nike brand were up 13%, excluding the impact of foreign currency. Nike brand sales to the wholesale channel increased by 9%, excluding foreign exchange. Direct-to-consumer revenues were up 25%, excluding foreign exchange, driven by a 51% increase in online sales, new stores, and 10% comp growth.

On a currency-neutral basis, Nike brand revenue growth was driven by robust growth in most key categories, including sportswear, running and the Jordan brand. The men’s, women’s and young athletes’ businesses each grew by double-digits. Revenues for Converse were $2.0 billion, up 2% on a currency-neutral basis, driven by strong growth in the US and the Asia-Pacific region that was slightly offset by lower sales in Europe.
As of May 31, worldwide future orders for June through November were up 8% year over year, or up 11% excluding foreign exchange, versus consensus of 12.0%. Future orders in North America were up 6.0% versus consensus of 7.5%; in Western Europe, they were up 11% versus consensus of 15.9%; in Central and Eastern Europe, they were up 7% versus consensus of 12.8%; in Greater China, they were up 24% versus consensus of 24.9%; in Japan, they were up 15% versus consensus of 16.7%; and in emerging markets, they were up 13% versus consensus of 12.8%.
Total inventory was up 12% year over year versus sales growth of 6% during the quarter.