Source: Company reports
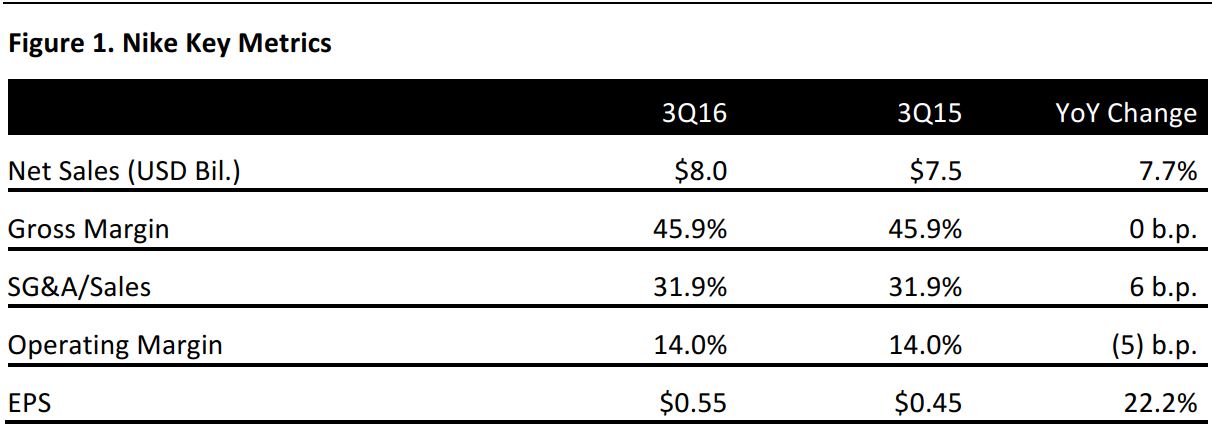
Within the NIKE brand, sales of footwear were $5.1 billion, up 11.1% year over year. Sales of apparel were $2.1 billion, up 8.4%. Sales of equipment were $352 million, down 7.6%. Sales from the Global Brand Divisions were $17 million, down 41.4%.
On a geographic basis, sales in North America were $3.7 billion, up 13.2% year over year. Sales in Western Europe were $1.4 billion, up 2.1%. Sales in Greater China were $982 million, up 22.6%. Sales in emerging markets were $879 million, down 8.0%. Sales in Japan were $205 million, up 23.5%. Sales in Central and Eastern Europe were $359 million, up 11.8%.
Income before taxes was $1.1 billion, up 8.5% year over year. The effective tax rate declined to 16.3% in fiscal 3Q16 from 24.4% in the year-ago quarter, due to an increase in the proportion of earnings from lower-tax regions, in addition to several tax credits and adjustments, some of which were retroactive. The share count decreased 1.7% year over year.
Inventories were $4.6 billion, up 8.1% year over year, driven by a 4% percent increase in NIKE Brand inventories, growth in the direct-to-consumer business and increases in average cost per unit, partially offset by changes in the value of inventories due to exchange rates.
OUTLOOK
As of the end of the quarter, futures orders for delivery during March–July 2016 were up 12% year over year and up 17% excluding currency changes.
Consensus estimates for fiscal 4Q16 are for revenues of $8.5 billion, up 9.0% year over year, and EPS of $0.55, compared to $0.49 in the year-ago quarter.
Consensus estimates for FY2016 are for revenues of $32.8 billion, up 7.3%, and EPS of $2.15, compared to $2.06 in FY2015.


