DIpil Das
US Retail Traffic and In-Store Metrics: May 2022
The Coresight Research US Retail Traffic and In-Store Metrics series reviews changes in selected store-based metrics, as reported by RetailNext. In this month’s report, we review store traffic changes through May 2022—which saw a deceleration in traffic growth at 8.1% compared to April’s 20.9% increase year over year.
Year-over-year changes are our core metric for store-based data; however, due to Covid-19 all data in this report from May to July 2021 is compared to 2019 (pre-pandemic), because there were widespread store closures from April to July 2020. From August 2021 onward, the comparison is made on a year-over-year basis.
- In May, ATV (average transaction value, or sales divided by transactions) increased by 2.5%, 200 basis points (bps) lower than April’s growth of 4.5%.
- The conversion rate (sales transactions as a percentage of traffic) decreased by 1.4 percentage points in May, versus April’s 2.1 percentage points decline year over year.
- Shopper yield (sales divided by traffic) decreased by 1.9% in May, following April’s 3.0% decline year over year, due to shoppers’ weaker intent to purchase due to high inflation.
- Unit per transaction (number of items purchased divided by number of transactions) decreased by 1.4% in May, deteriorating from April’s 0.2% decline. A number of retailers have reported that price-sensitive consumers are cutting back on discretionary purchases amid high inflation.
- Average unit retail (net sales divided by units sold) increased by 4.7% in May, following April’s 5.9% growth year over year.
Figure 1. US Store-Based Traffic and Sales: YoY % Change [caption id="attachment_150109" align="aligncenter" width="699"]
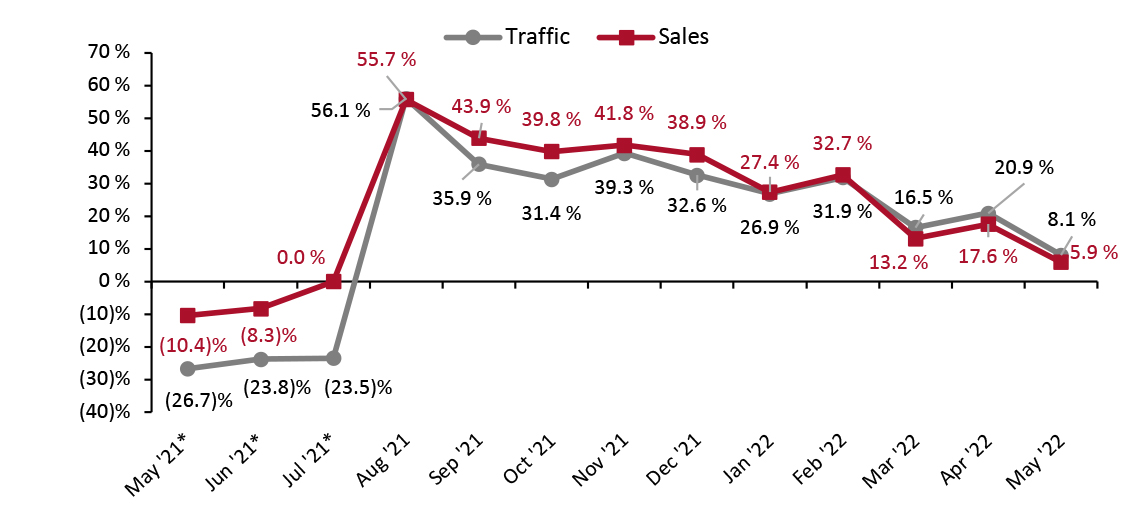 *May–July 2021 numbers are two-year % change due to store closures in the comparable period in 2020
 Source: RetailNext [/caption]
Figure 2. US Store-Based Nonfood Retail Metrics: YoY % Change [caption id="attachment_150110" align="aligncenter" width="701"]
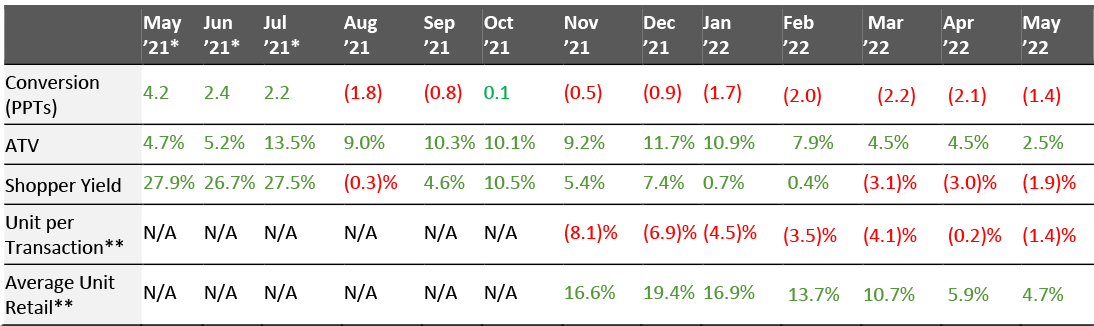 ATV=average transaction value; Shopper yield=Sales divided by traffic
 *May–July 2021 numbers are two-year % change due to store closures in the comparable period in 2020
**RetailNext started providing data on these from November 2021
Source: RetailNext [/caption]
Weekly Shopper Traffic Trends
Weekly data for May tracks the progress of store traffic over four weeks (May 1, 2022– May 28, 2022):
- On a week-by-week basis, traffic performance displayed a mixed trend as the month progressed. In the first week of May, traffic increased by 9.6%, a deceleration from the final week of April, which saw a traffic increase of 15.8%.
- The second week recorded the strongest performance—a 10.3% increase on a year-over-year basis due to the influence of Mother’s Day on May 8.
- The third week saw traffic growth of 6.7% on a year over year basis. The fourth week witnessed the lowest traffic growth of 4.6% compared to other weeks despite Saturday leading up to Memorial Day on May 30.
Traffic by Retailer Vertical
RetailNext publishes traffic trends for five sectors, which make up the majority of the data set: apparel, footwear, health and beauty, home and jewelry. Other sectors, including accessories, department stores, electronics, optical goods and sporting goods, are not broken out but impact the overall (average) traffic number.
Following the lifting of lockdown restrictions imposed in March and April 2020, traffic to nonessential retailers increased year over year between May and October 2020. However, in October and November 2020 this momentum faded. Although traffic trends improved marginally in December 2020 and January 2021, February was a weaker month. While traffic trends improved substantially in March 2021 even on a two-year basis (versus March 2019), traffic trends decelerated slightly in April. On a two-year basis, traffic trends improved from May to July. From August 2021 to April 2022 traffic growth remained positive on a year-over-year basis.
In May 2022, we saw a deceleration in traffic trends on a year-over-year basis: Nonessential retailers experienced an aggregate 8.1% increase in shopper traffic in May, a deceleration in growth from April’s 20.9% increase.
Performances varied across industry verticals in May 2022 on a year-over-year basis.
- Apparel was the strongest performing category in May, witnessing a 17.8% increase in traffic year over year. It was about 1,660 basis points (bps) lower than April. The first and second week witnessed the strongest traffic trends and the fourth week experienced the softest traffic trend in the apparel category. In May, the apparel specialty retail sector grew sales by 6%, ahead of apparel inflation of 5%.
- Footwear was the second-best category in May, increasing by 14.6% year over year, but 1,280 bps lower than April. Traffic trend improved from the first week to the third week. The third week witnessed the strongest traffic trend of 18.9% year over year in the footwear category.
- Traffic in the health and beauty sector increased by 10.4% on a year-over-year basis, a decrease of 1,620 bps from April. The health and beauty category witnessed the highest traffic trends in first two weeks but witnessed deterioration in the third week.
- In May, the jewelry sector saw a traffic increase of 5.2% year over year, a decrease of 1,060 bps from April. The first week saw the strongest traffic trend and the fourth week witnessed the lowest trend in jewelry sector.
- The weakest trend compared to other categories was seen in the home category. The home category witnessed a 10.6% decrease in traffic year over year. The fourth week had the lowest traffic trend compared to other weeks. The second week had the best traffic trend, with traffic declining 8.0% year over year. Consumers are cutting back in this sector, in real terms: The furniture retail sector is seeing low-single-digit percentage sales growth, which is well below the circa-10% rate of inflation for furniture and household supplies.
Figure 3. US Retail Traffic by Industry Vertical: YoY % Change [caption id="attachment_150123" align="aligncenter" width="699"]
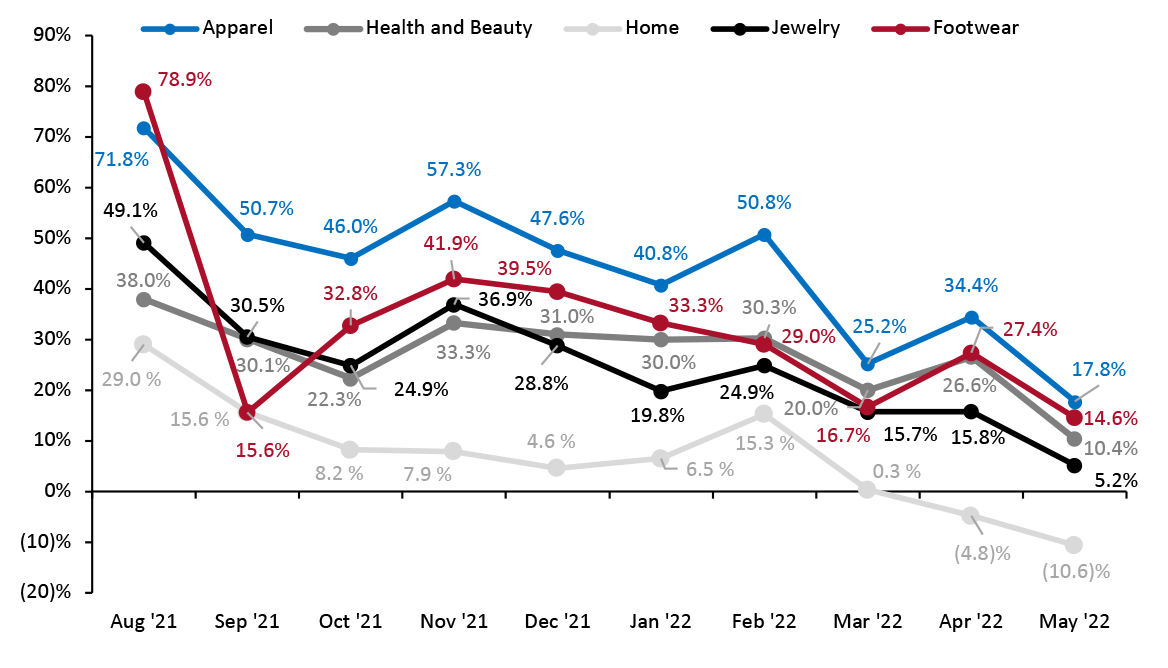 RetailNext started providing traffic trends by vertical on a year-over-year basis from August 2021
 Source: RetailNext [/caption]
Regional Traffic Trends
In May, the number of Covid-19 cases continued to increase. At the beginning of May, the government of Oakland, California removed indoor restrictions and proof of vaccination is no longer needed to enter indoor venues including restaurants, bars and gyms.
Retail traffic in May varied across region.
- The Northeast saw the strongest traffic trend in May, growing by 14.2% year over year. The second week had the best traffic trends due to New York and Massachusetts which saw a 27.0 % and 19.0% year over year increase, respectively.
- The traffic in the Midwest performed second-best, increasing by 8.5%, year over year. The third week had the best traffic trend, and second week had the lowest traffic trend compared to other weeks. Due to Mother’s Day, the traffic trend increased by 11.0% year over year on May 8.
- The West’s traffic increased by 8.4% year over year. The traffic trend was highest during the first week and declined as the month progressed. Traffic on Mother’s Day increased by 18.3% year over year. Traffic saw an 8.9% increase year over year on the Saturday leading up to Memorial Day.
- In May, the South experienced the softest traffic trend, increasing by 2.4% year over year. The fourth week had the lowest traffic trends compared to other weeks due to the impact of storms. During the fourth week, Georgia, Florida and North Carolina had the lowest traffic growth, at 4.7%, 1.8% and 1.2%, respectively.
Traffic by Retailer Location Type
In May, indoor traffic trends outperformed outdoor traffic trends, increasing by 7.6% and 6.0%, respectively, year over year. Non-mall traffic trends exceeded mall traffic trends, increasing by 10.7% and 6.6%, respectively, in comparison to 2021.
- Traffic by location type increased between 2.3% and 13.5% year over year.
- Other locations, including airports, casinos and hotels, performed best, increasing by 13.5% year over year.
- Street-front/freestanding locations performed second best with traffic increasing by 13.4%, followed by luxury locations which saw a 10.6% traffic increase year over year.
- Traditional malls registered traffic growth of 10.1% while Outlet Locations saw a traffic growth of 9.5% year over year.
- Lifestyle centers reported traffic growth of 8.0% while strip mall experienced the softest trend in month of May, registering traffic growth of 2.3% year over year.