Nitheesh NH
Introduction
What’s the Story? In our Leading Indicators of US Retail Sales monthly series, we examine several key macroeconomic indicators of US retail sales and analyze how they may impact the industry in the months to come. We analyze the latest available data as of May 5, 2022, from sources including the Federal Reserve Bank of St. Louis, the US Bureau of Economic Analysts (BEA), the US Bureau of Labor Statistics (BLS), the US Census Bureau and the US Department of Housing and Urban Development (HUD). Why It Matters Macroeconomic indicators have a significant impact on overall retail sales growth. Looking at 10 indicators (unemployment rate, labor force participation rate, disposable income per capita, average hourly wages, consumer sentiment, saving rate, gas price, federal funds rate, housing starts and housing prices), we can historically account for a majority of the variation in retail sales growth and create a strong basis for predicting sales moving forward. In Figure 1, we show the close correlation between retail sales growth predictions based on economic indicators and actual retail sales growth.Figure 1. US Actual Retail Sales ex. Auto and Gas Sales vs. Model Predicted Sales (YoY % Change) [caption id="attachment_146959" align="aligncenter" width="700"]
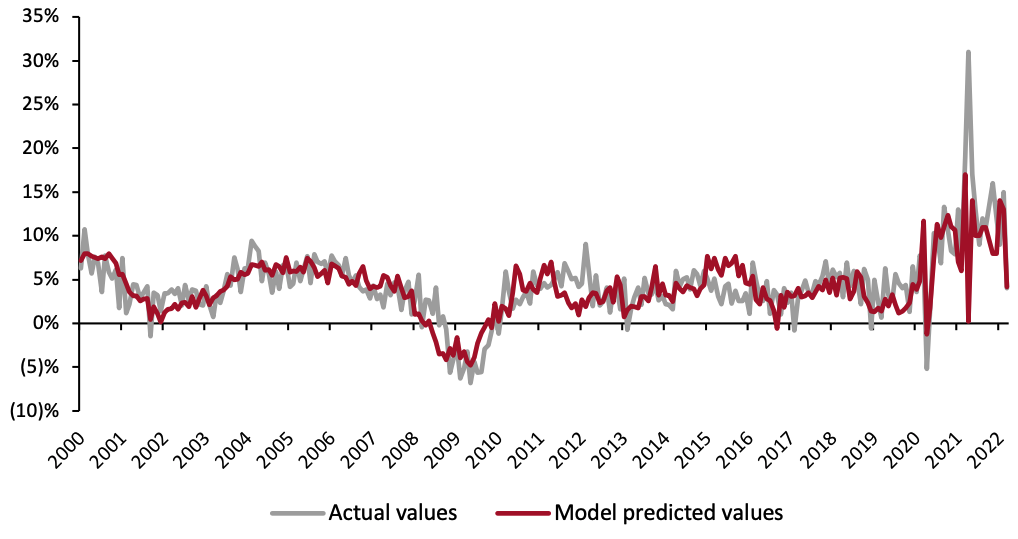 Through March 2022
Source: BEA/BLS/Federal Reserve Board of Governors/S&P/Coresight Research[/caption] During the first two months of 2022, retail sales performed strongly, exhibiting double-digit year-over-year growth. Then, in March, sales growth began to slow against the backdrop of six consecutive months of forty-year record-high consumer price increases. Furthermore, the Federal Reserve started its interest rate hike in March, raising interest rates by a quarter of a percentage point. On May 4, the Federal Reserve Bank increased rates by a steeper half-percentage point, the steepest hike since 2000. The interest rate hike is likely to cut into the wealth effect consumers had been feeling throughout the pandemic. Thus, the forty-year-high inflation, interest rate hikes and a further return to normalcy—with increased spending on services and experiences rather than goods—leads us to expect a more modest outlook for US retail sales growth throughout the remainder of 2022.
Leading Indicators of US Retail Sales: Coresight Research Analysis
Indicators Overview Of the 10 indicators we examined, five are likely to positively impact retail sales in the coming months. In March, the unemployment rate ticked down further, while the labor force participation rate continued to see slow-but-steady gains. Average hourly wage growth picked up again after moderating in February. Meanwhile, consumer sentiment began to improve as US gas prices began to ease due to the release of a million barrels of oil per day from the Strategic Petroleum Reserve (SPR). However, inflation in aggregate remains high, and consumers are beginning to push back against rising prices.Figure 2. US: Leading Indicators of Retail Sales, as of May 5, 2022* [caption id="attachment_146960" align="aligncenter" width="700"]
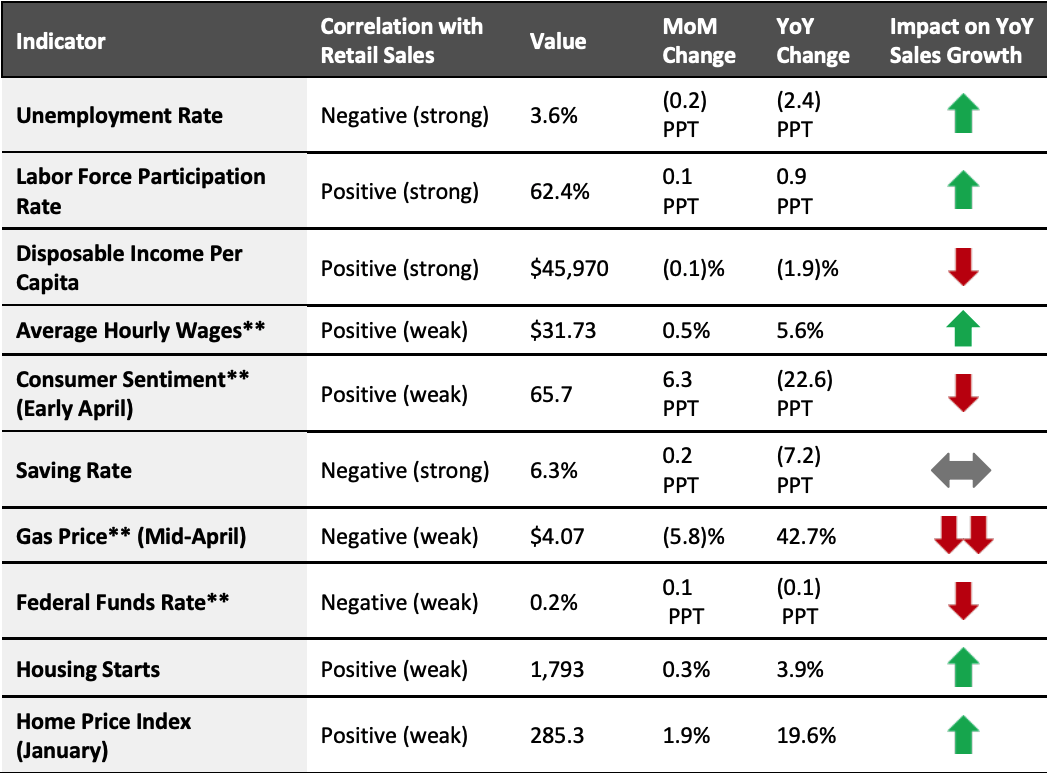 *Latest available data from March unless otherwise indicated
**Not included in predictive model
Source: BEA/BLS/Federal Reserve Board of Governors/S&P/University of Michigan/US Energy
Information Administration/Coresight Research[/caption] Our model, which analyzes correlations between retail sales and macroeconomic indicators, predicts a more modest outlook for retail sales growth in April, at 3.2% year-over-year growth. Looking ahead to May, our model predicts growth to accelerate slightly to 4.1%. Given the likely continuation of high inflation, these (nominal) rates would represent real-terms year-over-year declines. These estimates are against unusually strong 2021 comparatives, when the third round of stimulus checks resulted in a considerable boost in spending and elevated retail sales growth. In April 2021, US retail sales grew 30.6% from the previous year, and in May, retail sales increased 17.0% from the previous year. The continued modest sales growth is in line with our expectations against unusually strong 2021 comparatives. Other variables posing as headwinds to sales growth are inflation, rising interest rates and a return to services spending. As such, we expect to continue to observe modest sales growth in the months ahead (see Figure 3).
Figure 3. US Retail Sales ex. Auto and Gas (YoY % Change) [caption id="attachment_146961" align="aligncenter" width="700"]
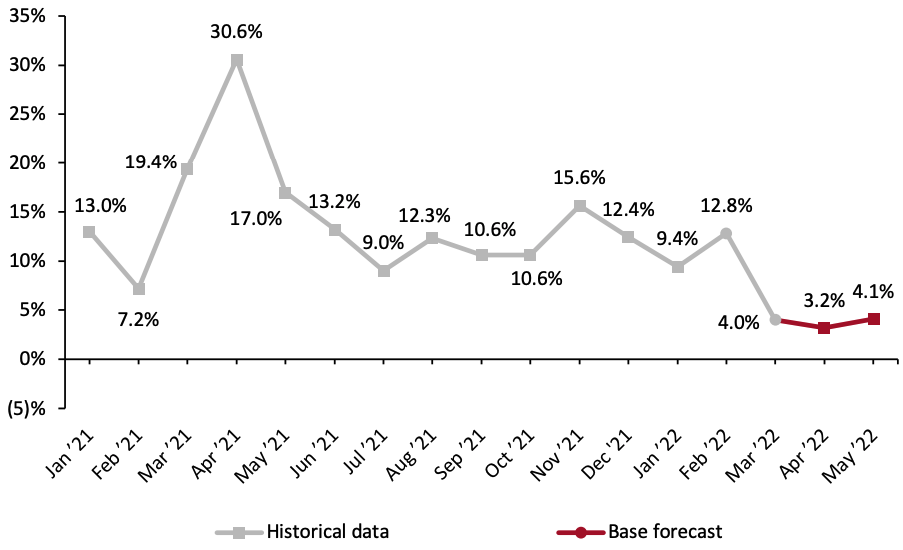 Figure 3. US Retail Sales ex. Auto and Gas (YoY % Change)[/caption]
The Job Market
The US added 431,000 jobs in nonfarm payrolls in March, a slowdown from a strong first two months of job creation. Still, BLS revisions to January and February job estimates paint a bright picture for job creation in the first quarter of 2022. January’s job total was revised to 504,000 (an addition of 23,000 jobs), while February’s total gained an additional 72,000 jobs, bringing its overall count to 750,000 jobs.
In March, leisure and hospitality, professional and business services, retail trade and manufacturing led overall job growth. In the same month, the retail sector added 49,000 workers and is 278,000 workers above its pre-pandemic level of employment. The manufacturing sector added 38,000 jobs in March but remains 128,000 workers below its pre-pandemic level of employment. In total, the US added 1.67 million jobs in the first quarter, posting a monthly average of 678,000.
The unemployment rate continued to move downward, falling from 3.8% in February to 3.6% in March. Meanwhile, the labor force participation rate saw another marginal increase in March, rising to 62.4% (see Figure 4). The labor force participation rate is growing closer to its pre-pandemic level, now just 1.0 PPT below its pre-pandemic level. The demand for labor remains high: in March, there were record numbers of both job openings (11.6 million) and workers who quit their jobs (4.5 million), according to data from the Job Openings and Labor Turnover (JOLT) survey.
Figure 3. US Retail Sales ex. Auto and Gas (YoY % Change)[/caption]
The Job Market
The US added 431,000 jobs in nonfarm payrolls in March, a slowdown from a strong first two months of job creation. Still, BLS revisions to January and February job estimates paint a bright picture for job creation in the first quarter of 2022. January’s job total was revised to 504,000 (an addition of 23,000 jobs), while February’s total gained an additional 72,000 jobs, bringing its overall count to 750,000 jobs.
In March, leisure and hospitality, professional and business services, retail trade and manufacturing led overall job growth. In the same month, the retail sector added 49,000 workers and is 278,000 workers above its pre-pandemic level of employment. The manufacturing sector added 38,000 jobs in March but remains 128,000 workers below its pre-pandemic level of employment. In total, the US added 1.67 million jobs in the first quarter, posting a monthly average of 678,000.
The unemployment rate continued to move downward, falling from 3.8% in February to 3.6% in March. Meanwhile, the labor force participation rate saw another marginal increase in March, rising to 62.4% (see Figure 4). The labor force participation rate is growing closer to its pre-pandemic level, now just 1.0 PPT below its pre-pandemic level. The demand for labor remains high: in March, there were record numbers of both job openings (11.6 million) and workers who quit their jobs (4.5 million), according to data from the Job Openings and Labor Turnover (JOLT) survey.
Figure 4. US Unemployment Rate (Left Axis, %) and Labor Force Participation Rate (Right Axis, %) [caption id="attachment_146962" align="aligncenter" width="700"]
 Source: BLS[/caption]
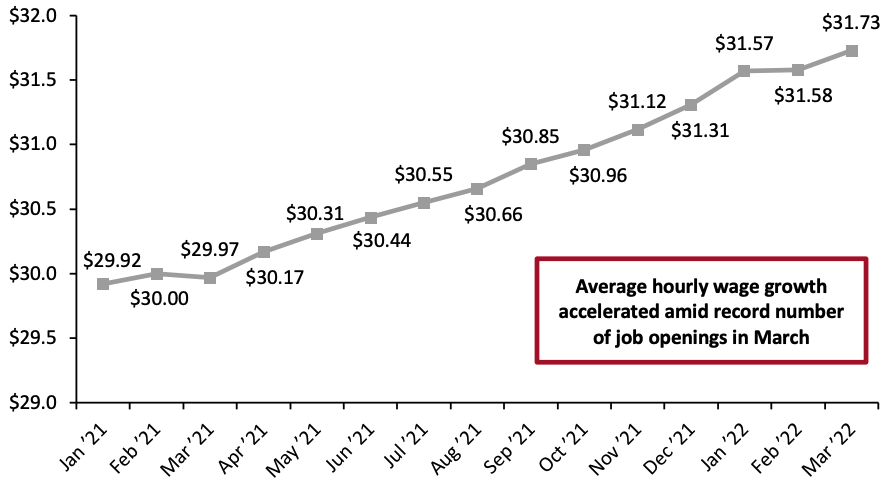
Average hourly wage growth picked up pace after slowing in February, as seen in Figure 5 below. Average hourly wages increased by $0.15 month over month. The increase may be small in dollar terms but is significant when considering the size of the US workforce. Year over year, average hourly wages grew 5.6%.
Source: BLS[/caption]
Average hourly wage growth picked up pace after slowing in February, as seen in Figure 5 below. Average hourly wages increased by $0.15 month over month. The increase may be small in dollar terms but is significant when considering the size of the US workforce. Year over year, average hourly wages grew 5.6%.
Figure 5. US Average Hourly Wages: All Private-Sector Employees (USD) [caption id="attachment_146963" align="aligncenter" width="700"]
 Source: BLS[/caption]
Implications
March had a slower month of job creation compared to January and February. Still, the US wrapped up a strong first quarter of job creation. Despite strong job creation, the demand for labor remains high within a still-tight labor market, pushing average hourly wage growth higher. The labor force participation rate remains below its pre-pandemic level; however, we have witnessed three consecutive months of marginal increases.
Meanwhile, the Federal Reserve Bank raised interest rates in March for the first time since 2018, marking the beginning of a series of interest rate hikes to come for the rest of 2022. The increase in interest rates is likely to draw more workers back into the labor force as higher rates will cut into the wealth effect consumers had been feeling, prompting some to return to the labor market.
Income, Savings and Sentiment
In February (latest available data), real disposable income per capita continued to decline steadily after having fallen substantially since the stimulus-driven spike in March 2021. However, we estimate that consumers have accrued an additional $2.7 trillion in savings between the start of 2020 and September 2021, based on data from the BEA. These extra savings equated to further elevated spending, as seen in the US Census Bureau’s January and February retail sales data. However, inflationary pressures are cutting into consumers’ spending ability, as evident in the retail sales estimates for March.
Source: BLS[/caption]
Implications
March had a slower month of job creation compared to January and February. Still, the US wrapped up a strong first quarter of job creation. Despite strong job creation, the demand for labor remains high within a still-tight labor market, pushing average hourly wage growth higher. The labor force participation rate remains below its pre-pandemic level; however, we have witnessed three consecutive months of marginal increases.
Meanwhile, the Federal Reserve Bank raised interest rates in March for the first time since 2018, marking the beginning of a series of interest rate hikes to come for the rest of 2022. The increase in interest rates is likely to draw more workers back into the labor force as higher rates will cut into the wealth effect consumers had been feeling, prompting some to return to the labor market.
Income, Savings and Sentiment
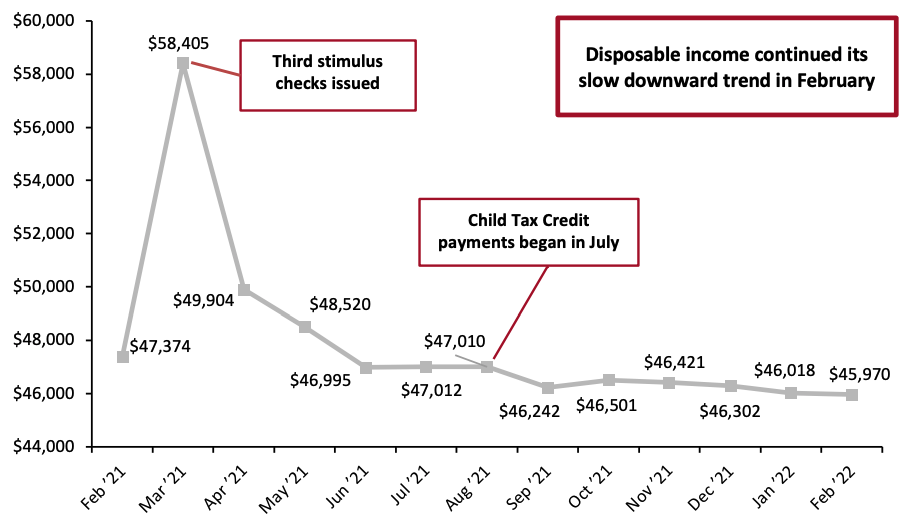
In February (latest available data), real disposable income per capita continued to decline steadily after having fallen substantially since the stimulus-driven spike in March 2021. However, we estimate that consumers have accrued an additional $2.7 trillion in savings between the start of 2020 and September 2021, based on data from the BEA. These extra savings equated to further elevated spending, as seen in the US Census Bureau’s January and February retail sales data. However, inflationary pressures are cutting into consumers’ spending ability, as evident in the retail sales estimates for March.
Figure 6. US Annualized Real Disposable Income Per Capita (USD) [caption id="attachment_146964" align="aligncenter" width="700"]
 Source: BEA[/caption]
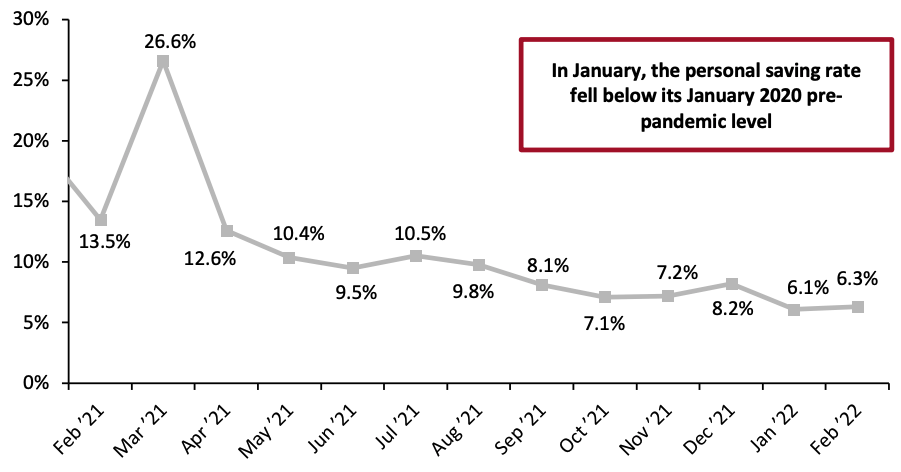
The personal savings rate increased by 0.2 PPTs month over month. Compared to a year ago, the personal savings rate is 7.2 PPTs lower, although this is against an elevated, pandemic-led level of savings. Compared to pre-pandemic February 2020, the personal savings rate is 2.0 PPTs lower, reflecting the impact of a forty-year high inflationary context. Consumers are being forced to spend more on essentials, resulting in a depressed savings rate.
Source: BEA[/caption]
The personal savings rate increased by 0.2 PPTs month over month. Compared to a year ago, the personal savings rate is 7.2 PPTs lower, although this is against an elevated, pandemic-led level of savings. Compared to pre-pandemic February 2020, the personal savings rate is 2.0 PPTs lower, reflecting the impact of a forty-year high inflationary context. Consumers are being forced to spend more on essentials, resulting in a depressed savings rate.
Figure 7. Personal Saving Rate (%) [caption id="attachment_146965" align="aligncenter" width="700"]
 Source: BEA[/caption]
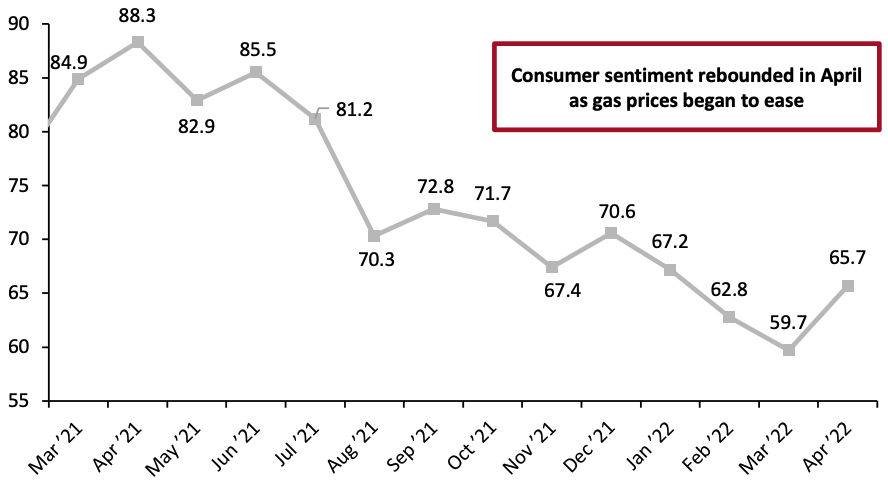
The preliminary April measure of consumer sentiment recorded an improvement over March. Consumer sentiment likely improved because of easing gas prices in April. Still, consumer sentiment is 22.6 PPTs lower than a year ago, amidst record-high inflation and growing concerns over a recession.
Source: BEA[/caption]
The preliminary April measure of consumer sentiment recorded an improvement over March. Consumer sentiment likely improved because of easing gas prices in April. Still, consumer sentiment is 22.6 PPTs lower than a year ago, amidst record-high inflation and growing concerns over a recession.
Figure 8. University of Michigan Consumer Sentiment Index [caption id="attachment_146966" align="aligncenter" width="700"]
 Source: University of Michigan[/caption]
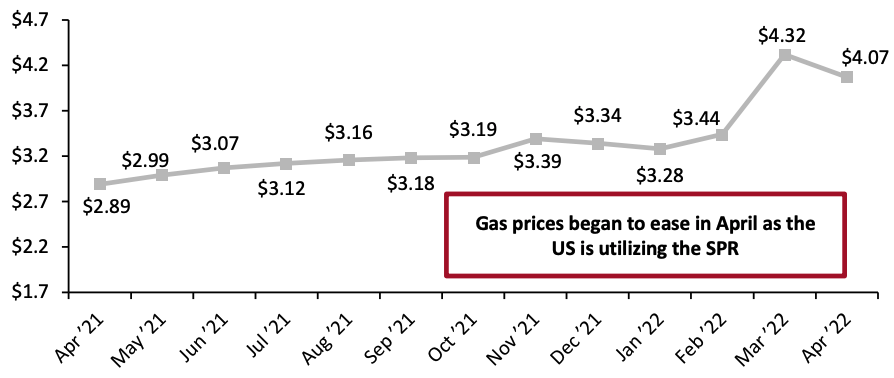
Gas prices have become increasingly volatile since Russia invaded Ukraine. On March 30, President Biden announced that his administration would utilize the SPR, releasing 180 million barrels of oil over the next six months to relieve upward pressure on US gas prices. As a result, the price of gas per gallon receded in April, falling 5.8% from the previous month. Despite the month-over-month decline, gas prices remain high in aggregate—year over year, the price of gas per gallon is 42.7% higher.
Source: University of Michigan[/caption]
Gas prices have become increasingly volatile since Russia invaded Ukraine. On March 30, President Biden announced that his administration would utilize the SPR, releasing 180 million barrels of oil over the next six months to relieve upward pressure on US gas prices. As a result, the price of gas per gallon receded in April, falling 5.8% from the previous month. Despite the month-over-month decline, gas prices remain high in aggregate—year over year, the price of gas per gallon is 42.7% higher.
Figure 9. US Regular All Formulations Gas Price (Dollars per Gallon) [caption id="attachment_146967" align="aligncenter" width="700"]
 Source: US Energy Information Administration[/caption]
Implications
Higher gasoline prices have a multiplier effect throughout the entire economy, impacting both the cost of goods delivery and personal travel. With gas prices at their highest level in over a decade—and inflation remaining high in aggregate—consumers’ spending power is diminished. However, the short-term outlook is hopeful as gas prices began to ease in April.
Housing
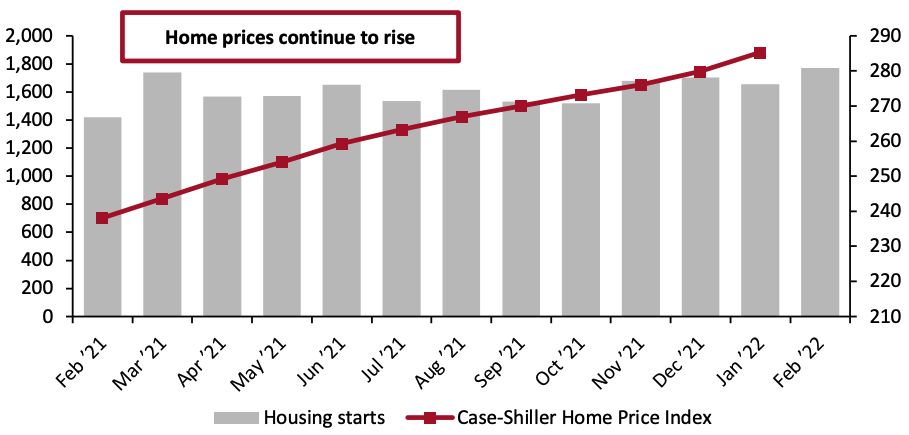
Housing starts remained elevated in March with 1.8 million new housing starts, a 0.3% increase from the prior month and a 3.9% increase year over year.
Home prices continued to climb in January (the latest month for which Case-Shiller Index data is available), reaching 285.3 points, up from 280.0 points in December. Rising home prices can create a wealth effect, making consumers feel more affluent and emboldening them to spend. However, more recently, on March 16, the Federal Reserve Bank raised interest rates by one-quarter of a percentage point, the first rise since 2008. Then, on May 4, the Federal Reserve Bank raised interest rates even higher, this time by a half of a percentage point (the steepest hike since 2000). Consequently, average thirty-year fixed mortgage rates have risen above 5.0% and, as of May 5, stand at their highest level since August 2009, according to Freddie Mac, cutting into consumers’ wealth effect.
Source: US Energy Information Administration[/caption]
Implications
Higher gasoline prices have a multiplier effect throughout the entire economy, impacting both the cost of goods delivery and personal travel. With gas prices at their highest level in over a decade—and inflation remaining high in aggregate—consumers’ spending power is diminished. However, the short-term outlook is hopeful as gas prices began to ease in April.
Housing
Housing starts remained elevated in March with 1.8 million new housing starts, a 0.3% increase from the prior month and a 3.9% increase year over year.
Home prices continued to climb in January (the latest month for which Case-Shiller Index data is available), reaching 285.3 points, up from 280.0 points in December. Rising home prices can create a wealth effect, making consumers feel more affluent and emboldening them to spend. However, more recently, on March 16, the Federal Reserve Bank raised interest rates by one-quarter of a percentage point, the first rise since 2008. Then, on May 4, the Federal Reserve Bank raised interest rates even higher, this time by a half of a percentage point (the steepest hike since 2000). Consequently, average thirty-year fixed mortgage rates have risen above 5.0% and, as of May 5, stand at their highest level since August 2009, according to Freddie Mac, cutting into consumers’ wealth effect.
Figure 10. Housing Starts (Thousands, Left Axis) and Case-Shiller US Home Price Index (Right Axis) [caption id="attachment_146968" align="aligncenter" width="700"]
 Source: HUD/US Census Bureau[/caption]
While the rise in housing prices causes some consumers to feel more affluent, it also means many are forced to rent rather than buy, contributing to rising rental prices. In March, consumer prices for rent of primary residences increased 4.4% from the previous year, according to the BLS—its fastest pace since May 2007.
Implications
The strength of the housing market—especially house prices—had been a significant benefit for retail sales. House moves contribute to furniture, furnishings, home improvement and appliance sales and can trickle down further to discretionary sectors, such as electronics. March saw a slowdown in sales in these sectors, potentially related to rising mortgage rates and decreasing new home purchases. While building material and garden supply dealers’ sales grew modestly by 1.8%, electronics sales declined 9.6% from the previous year.
Source: HUD/US Census Bureau[/caption]
While the rise in housing prices causes some consumers to feel more affluent, it also means many are forced to rent rather than buy, contributing to rising rental prices. In March, consumer prices for rent of primary residences increased 4.4% from the previous year, according to the BLS—its fastest pace since May 2007.
Implications
The strength of the housing market—especially house prices—had been a significant benefit for retail sales. House moves contribute to furniture, furnishings, home improvement and appliance sales and can trickle down further to discretionary sectors, such as electronics. March saw a slowdown in sales in these sectors, potentially related to rising mortgage rates and decreasing new home purchases. While building material and garden supply dealers’ sales grew modestly by 1.8%, electronics sales declined 9.6% from the previous year.
What We Think
Retail sales were off to a strong start through the first two months of 2022, but we expect to see more modest growth throughout the rest of the year. Year over year, retail sales growth may seem comparatively lower than in prior months, since these numbers will be compared against a stimulus-driven historic jump in sales growth at the same time last year. In real terms, we expect year-over-year growth in total retail sales to remain negative in May. Implications for Brands/Retailers- The continuation of interest rate hikes, and most recently a steeper hike, is likely to gradually reduce demand for goods in the long term. Sales numbers may not look strong year over year, but brands must be mindful of their 2021 comparatives: the unusual stimulus-driven spike in sales last year.
- As we move further into 2022, we should expect more modest, mid-single-digit sales growth, as a further return to normalcy will direct an increased proportion of discretionary spending toward services and experiences rather than goods.
- The Federal Reserve’s recent interest rate hikes will dampen the wealth effect consumers had been feeling, potentially resulting in a slight pullback in overall spending. Consumer spending in March was higher than anticipated; however, much of that was geared towards services.