DIpil Das
The Coresight Research US Retail Traffic and In-Store Metrics series reviews changes in selected store-based metrics, as reported by RetailNext. In this month’s report, we review store traffic changes through May 2021—a month that saw the benefits of stimulus check distribution and continued rollout of the Covid-19 vaccines, alongside several states lifting pandemic-related restrictions amid the decline in new cases. This series usually reviews year-over-year changes in store-based metrics; however, all March, April and May data in this report are compared to 2019 as stores began closing in March 2020 due to Covid-19 and most stores were closed in April and May 2020.
RetailNext’s coverage does not include food retailers but does include some other retail sectors deemed essential; the exclusion of food retail means that the figures cited below almost certainly overstate recent declines in total retail traffic.
Figure 1. US Store-Based Nonfood Retail Metrics: YoY % Change [caption id="attachment_128722" align="aligncenter" width="725"]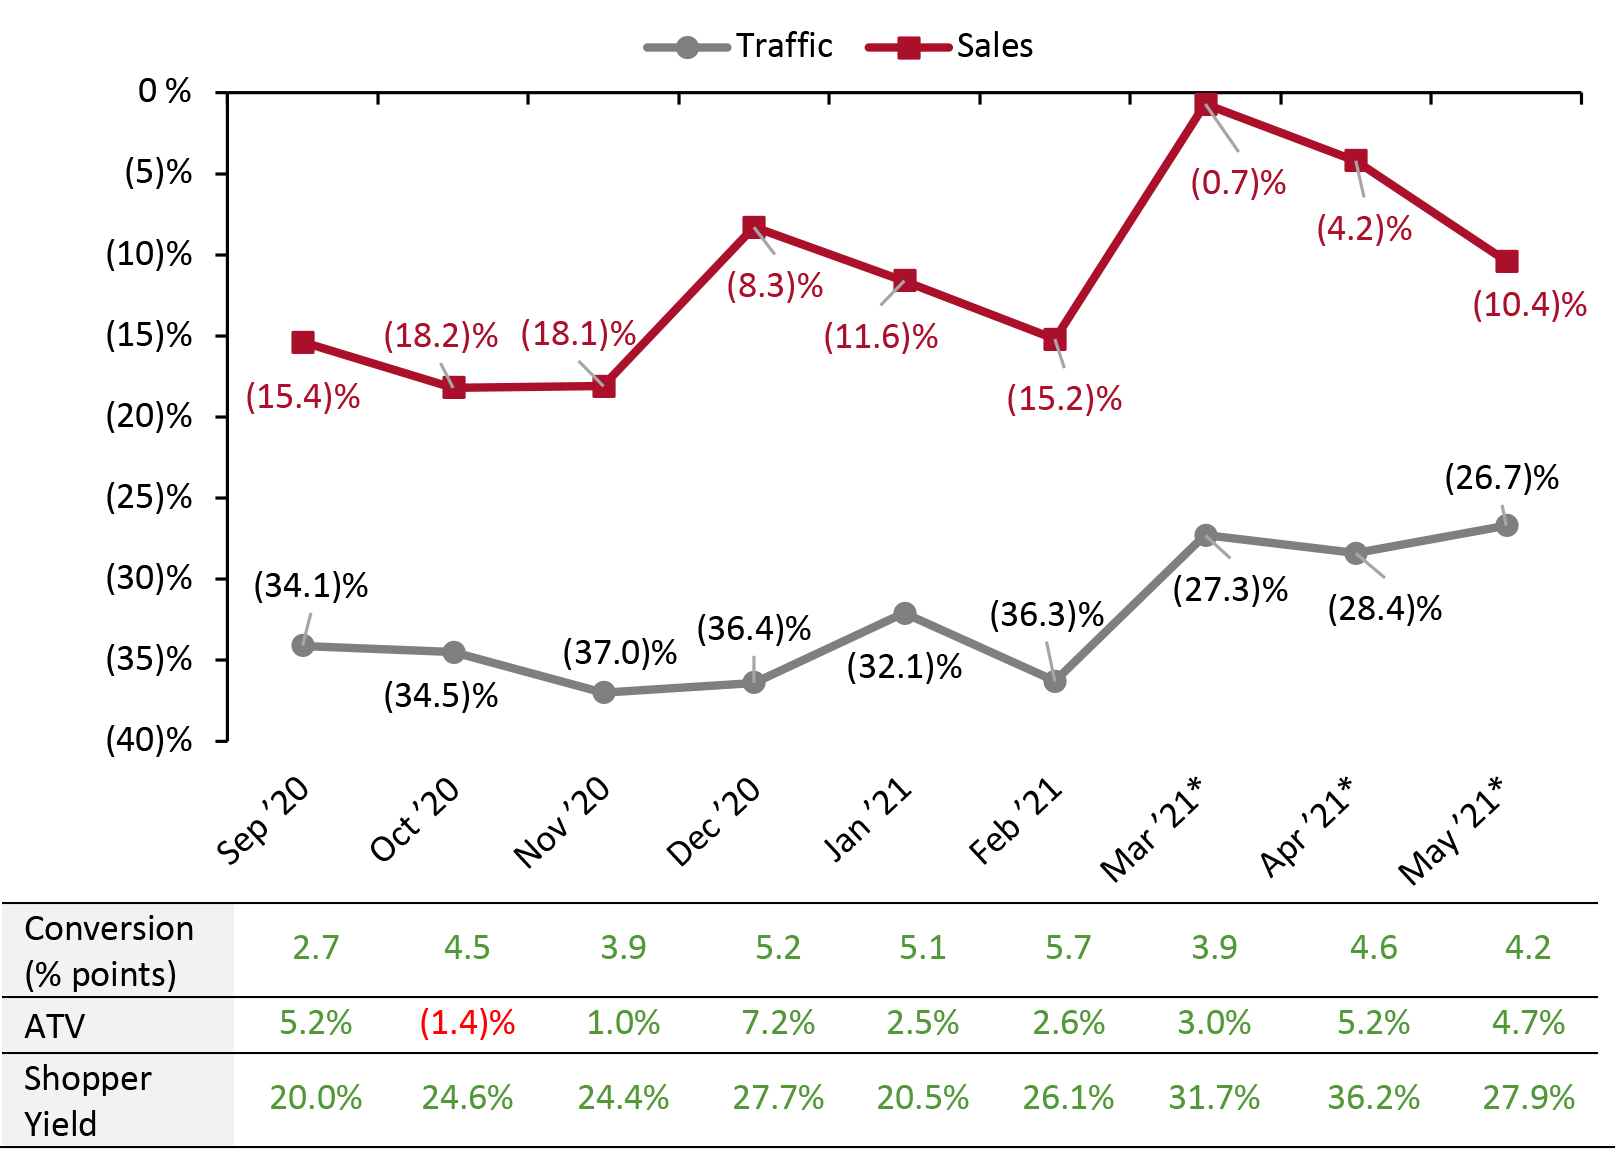 ATV=average transaction value; Shopper yield=Sales divided by traffic
*March, April and May 2021 numbers are compared to 2019 as stores began closing in March 2020 due to Covid-19 and most stores were closed in April and May 2020.
Source: RetailNext [/caption] Weekly Shopper Traffic Trends Weekly data for May tracks the progress of store traffic over four weeks (May 2, 2021–May 29, 2021):
Figure 2. US Retail Traffic by Industry Vertical: YoY % Change [caption id="attachment_128723" align="aligncenter" width="725"]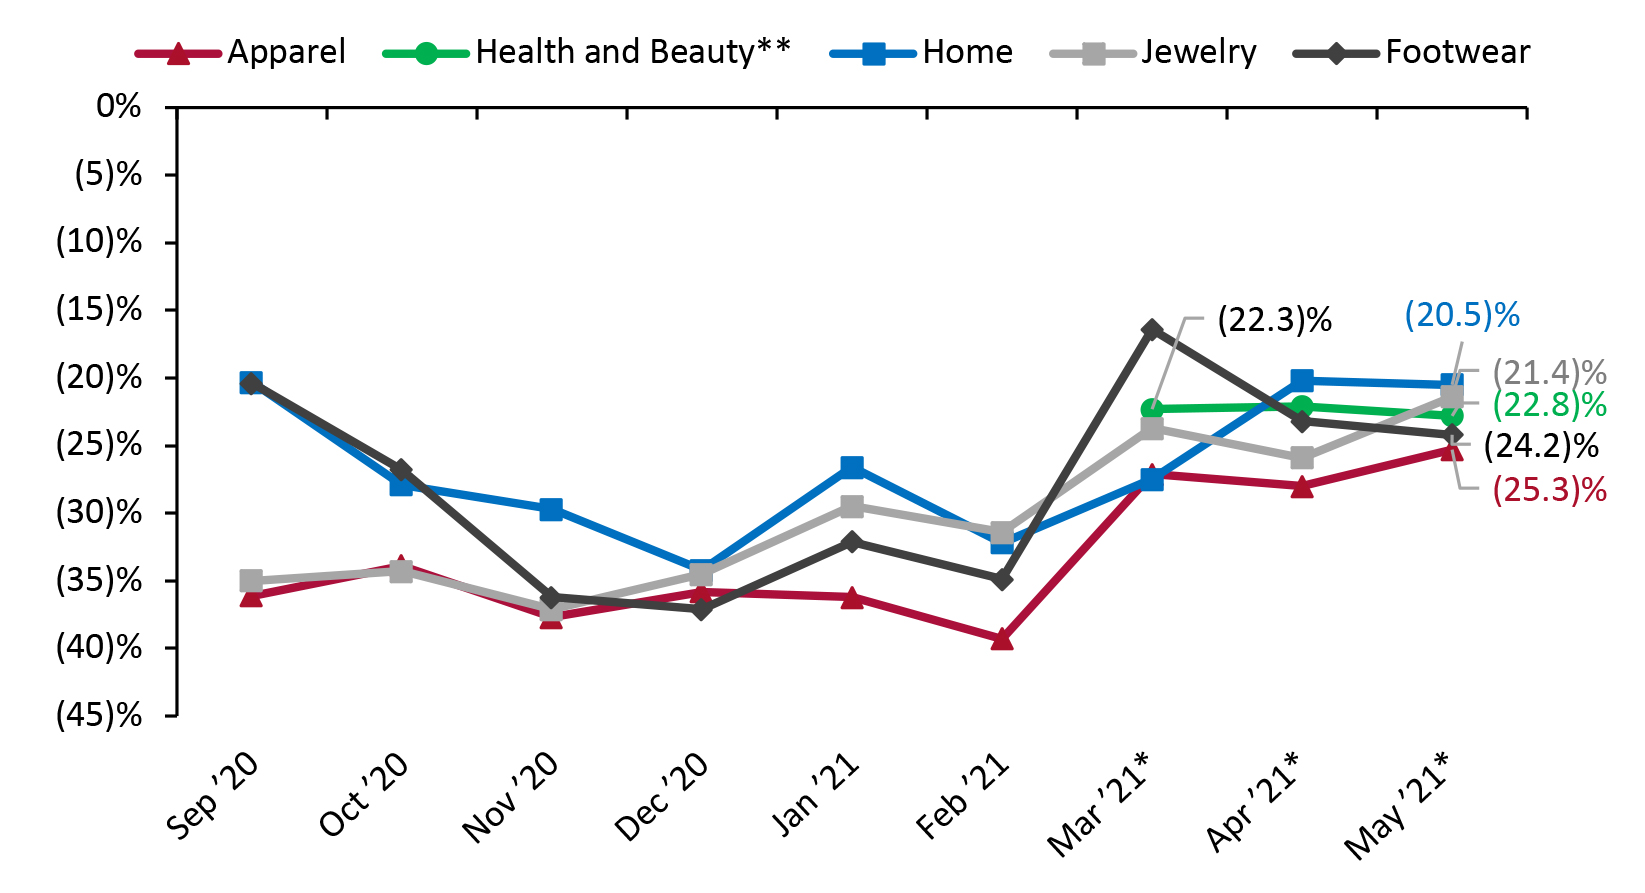 *March, April and May 2021 numbers are compared to 2019 as stores began closing in March 2020 due to Covid-19 and most stores were closed in April and May 2020.
**RetailNext started providing traffic trends for the health and beauty sector from March 2021.
Source: RetailNext [/caption] Regional Traffic Trends In May, new Covid-19 cases declined consistently. As a result, several states lifted pandemic-related restrictions which boosted traffic. Furthermore, to increase vaccination rates and reach community immunity sooner, many states and companies began incentive programs—offering prospects to win big prizes, including $1 million and college scholarships for those who get vaccinated. Retail traffic in May varied across regions:
- May saw a strengthening in traffic trends: Traffic declined by 26.7% on a two-year basis in May, higher than April’s 28.4% decline versus 2019.
- The conversion rate (sales transactions as a percentage of traffic) grew 4.2 percentage points in May, versus April’s growth of 4.6 percentage points.
- In May, ATV (sales divided by transactions) increased by 4.7%, compared to April’s 5.2% growth.
- Shopper yield (sales divided by traffic) increased by 27.9% in May, versus April’s 36.2% growth.
Figure 1. US Store-Based Nonfood Retail Metrics: YoY % Change [caption id="attachment_128722" align="aligncenter" width="725"]
ATV=average transaction value; Shopper yield=Sales divided by traffic *March, April and May 2021 numbers are compared to 2019 as stores began closing in March 2020 due to Covid-19 and most stores were closed in April and May 2020.
Source: RetailNext [/caption] Weekly Shopper Traffic Trends Weekly data for May tracks the progress of store traffic over four weeks (May 2, 2021–May 29, 2021):
- Traffic performed best in the first week of May, with declines at 24.4% on a two-year basis, an improvement from the final week of April, which saw a traffic decline of 27.1%.
- Traffic declines slightly accelerated to 25.4% in the second week of May.
- In the third week, declines accelerated substantially to 28.4%, impacted by Memorial Day Weekend’s shift from the third week to the fourth.
- In the fourth week, traffic declines eased to 26.5%, owing to the favorable impact of Memorial Day Weekend and a drop in new Covid-19 cases.
- Although the apparel sector witnessed the softest traffic trends among the sectors published by RetailNext, it outperformed the national average. The apparel sector reported traffic decline of 25.3%, an improvement of 270 basis points compared to April.
- The home sector posted the lowest traffic decline at 20.5%, though a slight increase of 30 basis points compared to April.
- The jewelry sector was the second best-performing category, with a traffic decline of 21.4%, an improvement of 450 basis points compared to April.
- The health and beauty sector saw a traffic decrease of 22.8%, an increase of 70 basis points from April.
- The footwear sector posted a traffic decrease of 24.2%, an increase of 100 basis points compared to April.
Figure 2. US Retail Traffic by Industry Vertical: YoY % Change [caption id="attachment_128723" align="aligncenter" width="725"]
*March, April and May 2021 numbers are compared to 2019 as stores began closing in March 2020 due to Covid-19 and most stores were closed in April and May 2020. **RetailNext started providing traffic trends for the health and beauty sector from March 2021.
Source: RetailNext [/caption] Regional Traffic Trends In May, new Covid-19 cases declined consistently. As a result, several states lifted pandemic-related restrictions which boosted traffic. Furthermore, to increase vaccination rates and reach community immunity sooner, many states and companies began incentive programs—offering prospects to win big prizes, including $1 million and college scholarships for those who get vaccinated. Retail traffic in May varied across regions:
- The Northeast was the worst-performing region, witnessing a traffic decline of 29.1% as compared to 2019. The region saw its traffic trends deteriorating gradually over first three weeks but improving substantially in the final week.
- The South posted the best traffic performance for the month, with a 21.2% decline compared to 2019. The region saw its best traffic trends in the first week of the month. Several states in the region, including North Carolina and Virginia, were impacted in the second and third weeks by the pipeline cyberattack, which contributed to a deterioration in traffic trends before improving in the fourth week.
- The West posted a 25.5% traffic decline for the month. The region saw its best trends in the first and second weeks, with traffic decline of 23–24% before deteriorating in the third and fourth weeks. With California reopening its economy on June 15, we expect to see an improvement in June’s traffic trends.
- The Midwest posted an overall traffic decline of 29.0%. The region saw its worst traffic trends in the third week of the month, with a decline of 32.1%, likely affected by the Memorial Day Weekend’s shift from the third week to the fourth.
- Traffic by mall location type declined between 12.2% and 31.4%—strip malls outperformed all other location types, with a decline of only 12.2 %. These locations benefited from being open-air and from the presence of nondiscretionary retailers, such as food retailers.
- Other retail locations, including airports, casinos and hotels, reported the largest traffic decline of 31.4%. Many of these locations are situated in destination areas and were impacted by lower foot traffic in tourist areas owing to travel restrictions, as well as consumers avoiding such areas amid the pandemic.
- Street-front/freestanding locations witnessed the second-largest traffic decline of 31.1%. Outlet and luxury locations reported traffic declines of 30.5% and 29.0%, respectively.
- Lifestyle centers and traditional mall locations underperformed the national average, with declines of 24%.