
albert Chan
US Retail Sales: May 2021
Coresight Research’s measure of core retail sales is the unadjusted year-over-year change, excluding gasoline and automobiles. This metric slowed to a still strong 17.4% in May from a very high 30.6% in April, as reported by the US Census Bureau on June 15, 2021.
This dip in year-over-year growth was expected: April sales growth was much stronger, largely due to weak comparatives in 2020. However, May 2020 saw positive year-over-year growth, despite falling squarely in the period when lockdowns were most stringent in the US, acting as a moderating effect on May 2021’s growth.
Figure 1. US Total Retail Sales ex. Gasoline and Automobiles: YoY % Change
[caption id="attachment_128667" align="aligncenter" width="700"]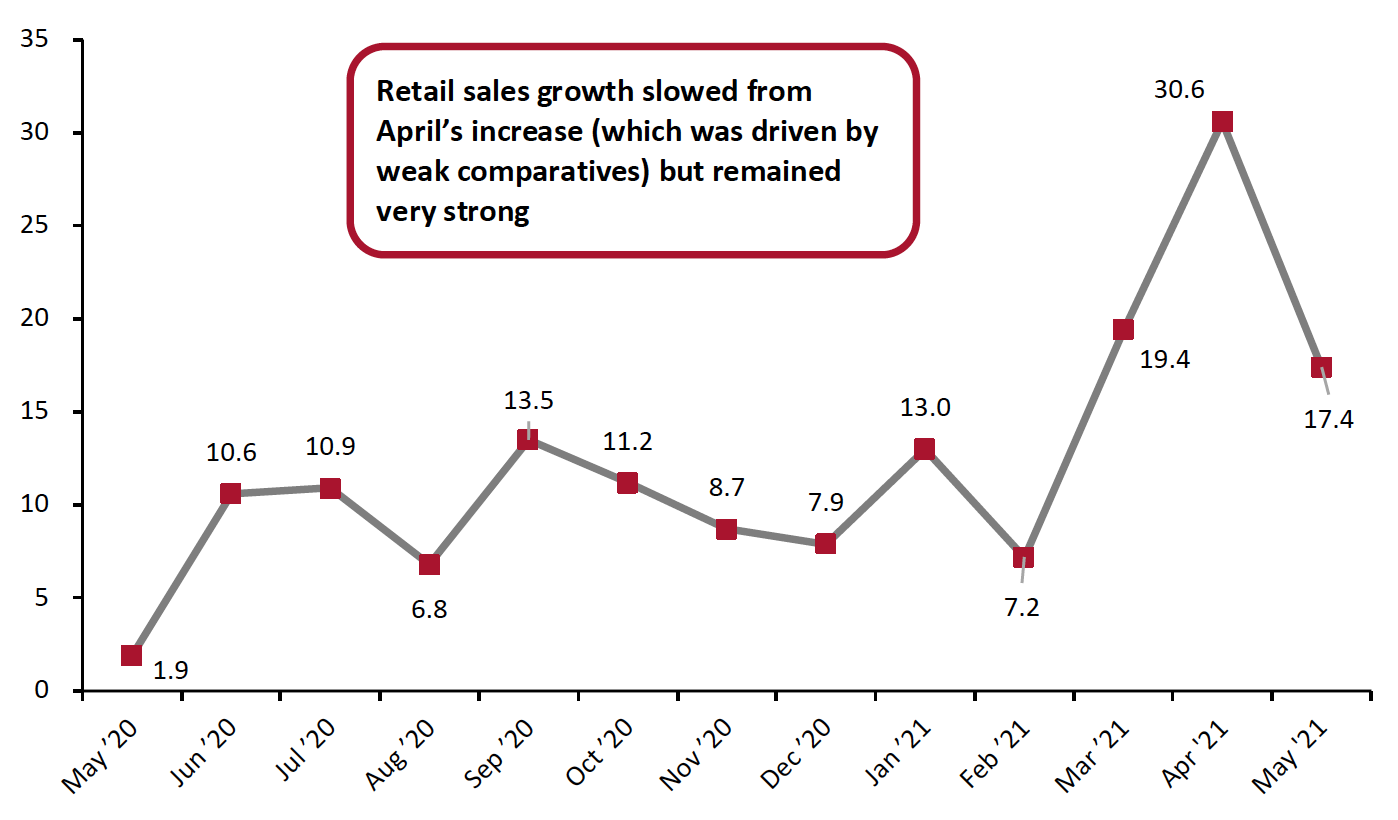 Data are not seasonally adjusted
Source: US Census Bureau/Coresight Research[/caption]
Although the difference is less stark, May sales were still weaker than April’s when compared to the more consistent comparatives of 2019. May sales grew 19.6% from 2019 values, down nearly five percentage points from April’s growth—however, on a two-year basis, this was still the third strongest growth in sales of any month in the past year. The dip in sales can partly be attributed to consumers depleting cash from stimulus checks, which were issued in March and saw sales grow 27.1% on a two-year basis that month.
Figure 2. US Total Retail Sales ex. Gasoline and Automobiles: % Change from Two Years Prior
[caption id="attachment_128668" align="aligncenter" width="700"]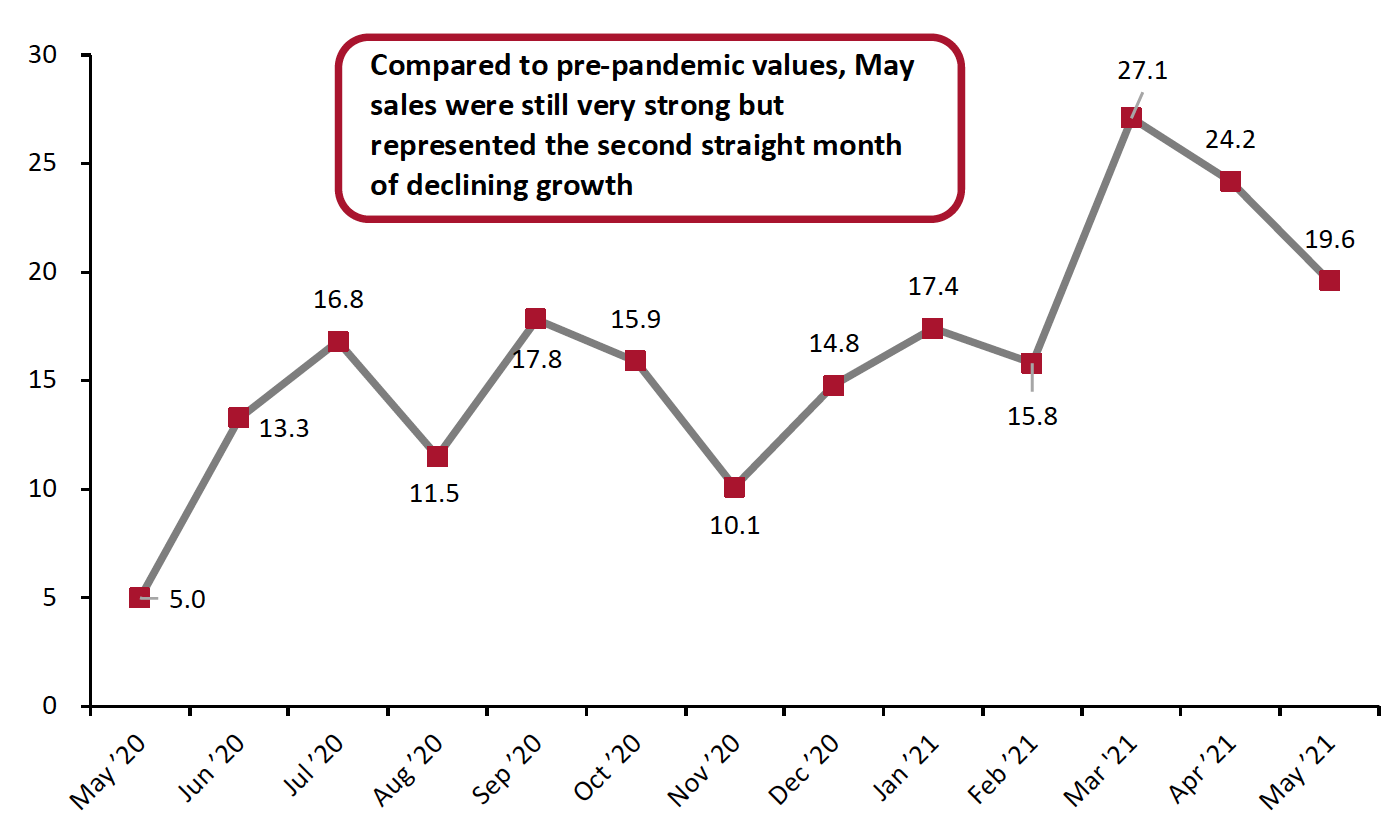 Source: US Census Bureau/Coresight Research[/caption]
Continued high demand for cars pushed seasonally adjusted sales including gas and automobiles higher than retail sales growth excluding these two categories. Driven by a 107.2% year-over-year increase in automobile and parts dealer sales, seasonally adjusted retail sales including gas and automobiles rose by 24.4% in May. Although this was considerably lower growth than April’s 48.1% rise, it was very high considering that sales in May 2020 sales were much stronger overall than in April 2020. Automobile manufacturers are still facing shortages of microchips—which could cause them difficulty in producing enough supply to meet continued high demand, potentially further pushing up the cost of used cars.
Figure 3. US Total Retail Sales incl. Gasoline and Automobiles: YoY % Change
[caption id="attachment_128669" align="aligncenter" width="700"]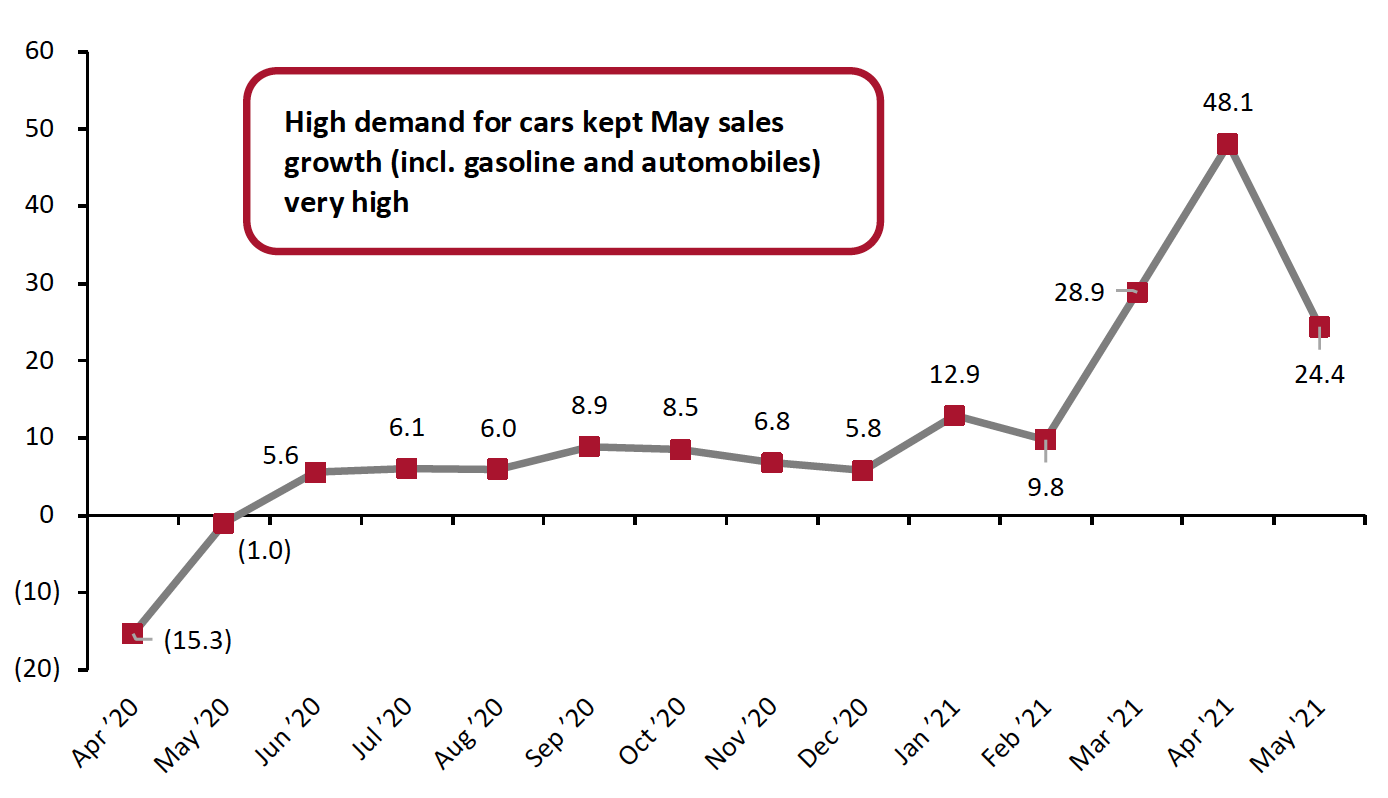 Data are seasonally adjusted
Source: US Census Bureau/Coresight Research[/caption]
Sales Continue To Drop Slightly, Month over Month
On a month-over-month basis, seasonally adjusted sales (excluding automobiles and gas) dropped by 1.3%—the second consecutive month of decline. However, the overall trend for sales remains largely positive: Sharp spikes in January and March more than compensate for the recent slight declines, keeping seasonally adjusted sales well above their level in the holiday season.
Figure 4. US Total Retail Sales ex. Gasoline and Automobiles: MoM % Change
[caption id="attachment_128670" align="aligncenter" width="700"]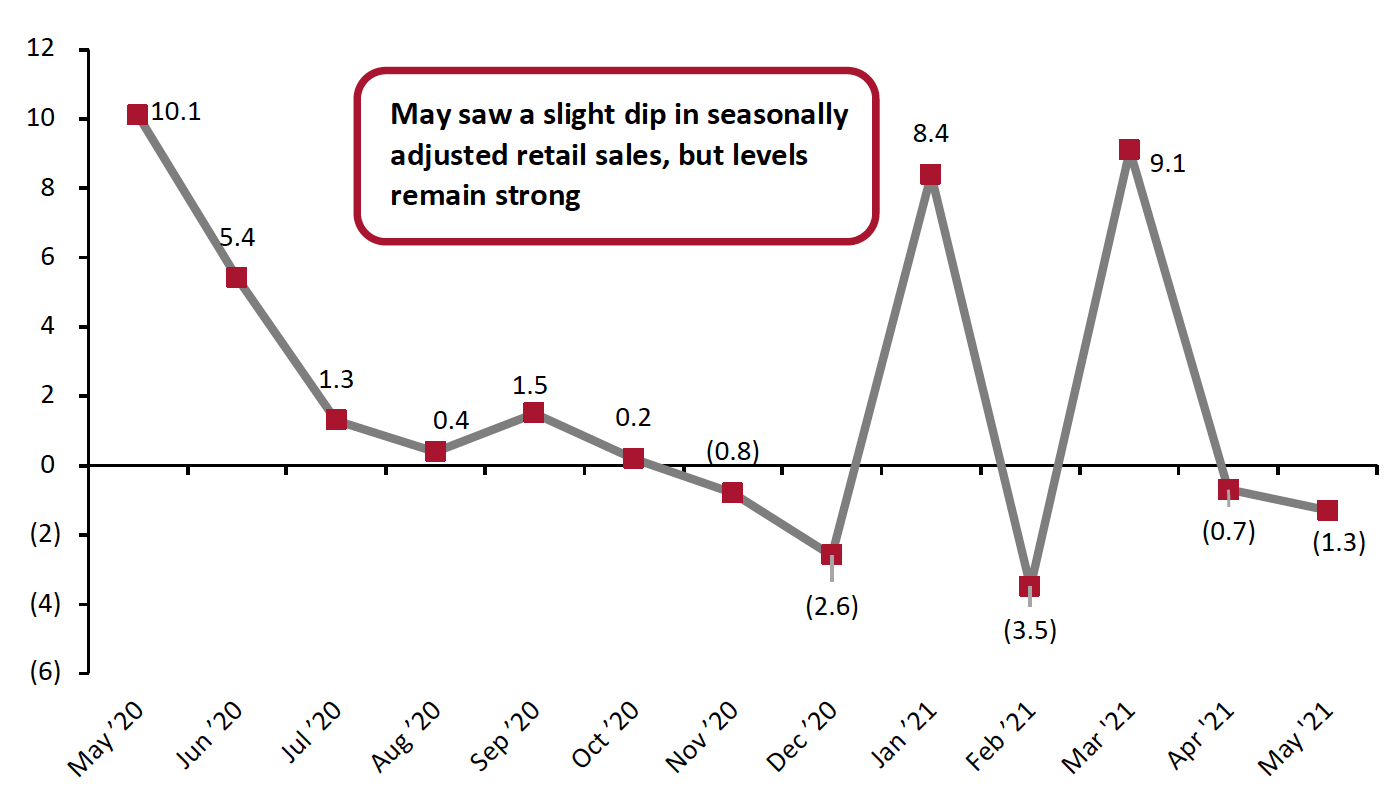 Data are seasonally adjusted
Source: US Census Bureau/Coresight Research[/caption]
Retail Sales Growth by Sector
Although overall retail sales saw positive growth in May 2020, Covid-19’s spread through the US last spring hit some sectors much harder than others. To control for the effects of the pandemic in 2020’s retail sales figures, we largely compare May 2021 sales to pre-pandemic May 2019 sales in this section.
In a very strong month, five sectors saw sales growth of 15% or more from 2019 levels:
- Nonstore retailers continued to thrive in May, with sales growing by 33.8% from 2019 values. Perhaps even more impressively, this sector saw sales growth of 8.2% from 2020, when lockdowns kept consumers indoors and pushed sales online. Continued surges in this sector, even as stores across the country are now open without restrictions, suggest that there will not be a post-pandemic e-commerce retrenchment.
- Home-improvement retailers (“building material and garden supply retailers” in the table below) saw growth of 25.4% from 2019 levels—though very strong, it was weaker than April’s 38.7% rise.
- Furniture and home-furnishings stores saw a similar pattern of growth in May: sales grew by a strong 17.6% but declined from April’s even stronger 26.1%. With housing starts now slowing, and potentially falling further as prices become prohibitively expensive, this sector may see a slowdown in the coming months.
- Sporting goods and hobby store sales rose 37.3% from 2019 values which, remarkably, still represented the second straight month of slowing growth in the sector. Compared to 2020 values, the sector saw similar levels of growth, rising 40.9% year over year.
- Miscellaneous store retailers saw a major slowdown from April’s 29.5% growth from 2019 levels but still saw solid 15.7% growth over the two-year period.
Several sectors saw more moderate sales increases from 2019 levels, though were still double digits:
- Food and beverage store sales grew 14.6% from 2019 levels in May, roughly level with April’s 14.8% growth. However, food and beverage saw very strong sales at the pandemic’s outset in 2020 and was the only sector to see sales decline from 2020 values, falling 0.2% year over year.
- Clothing and clothing accessory stores saw sales rise 13.7% from 2019 levels. This increased from April’s 9.4% growth, following a much stronger March. May’s strong stimulus-free growth indicates that a more comprehensive and sustained recovery in the sector may be underway.
- Health and personal care store sales grew 12.0% from 2019 values, holding roughly even with April’s growth.
Electronics and appliance stores saw disappointing growth from 2019 levels in May:
- Following a strong April, electronics and appliance store sales saw disappointing growth of just 6.0% from 2019 levels. Many in the industry expect supply to be gated this year rather than demand, as microchip shortages hamstring their ability to produce and acquire products, mainly in the personal computer and appliance space.
For the third consecutive month, just one sector saw sales decline versus 2019 levels:
- While general merchandise stores again saw solid growth of 13.7% from 2019, department store sales fell by 0.5%—the worst performance of any category, though a substantial improvement from its 3.7% decline in April.
Figure 5. US Total Retail Sales, by Sector: YoY % Change from 2020 (Top) and 2019 (Bottom)
[wpdatatable id=1034] [wpdatatable id=1035] Data are not seasonally adjusted Source: US Census Bureau/Coresight Research