DIpil Das
What’s the Story?
In our Leading Indicators of US Retail Sales monthly series, we examine several key macroeconomic indicators of US retail sales and analyze how they may impact the industry in the months to come. We analyze the latest available data, as of the end of May 2021, from sources such as the US Census Bureau, the US Bureau of Economic Analysts (BEA), the US Bureau of Labor Statistics (BLS) and the US Department of Housing and Urban Development (HUD).Why It Matters
Macroeconomic indicators have a significant impact on overall retail sales growth. Looking at 10 indicators (unemployment rate, labor force participation rate, disposable income per capita, average hourly wages, consumer sentiment, savings rate, gas price, interest rate, housing starts and housing prices), we can historically account for a majority of the variation in retail sales growth and create a strong basis for predicting sales moving forward. The close correlation between retail sales growth predictions based on economic indicators and actual retail sales growth is shown in Figure 1.Figure 1. US Actual Retail Sales ex. Auto and Gas Sales vs. Model Predicted Sales, January 2000–January 2021 (YoY % Change) [caption id="attachment_128552" align="aligncenter" width="725"]
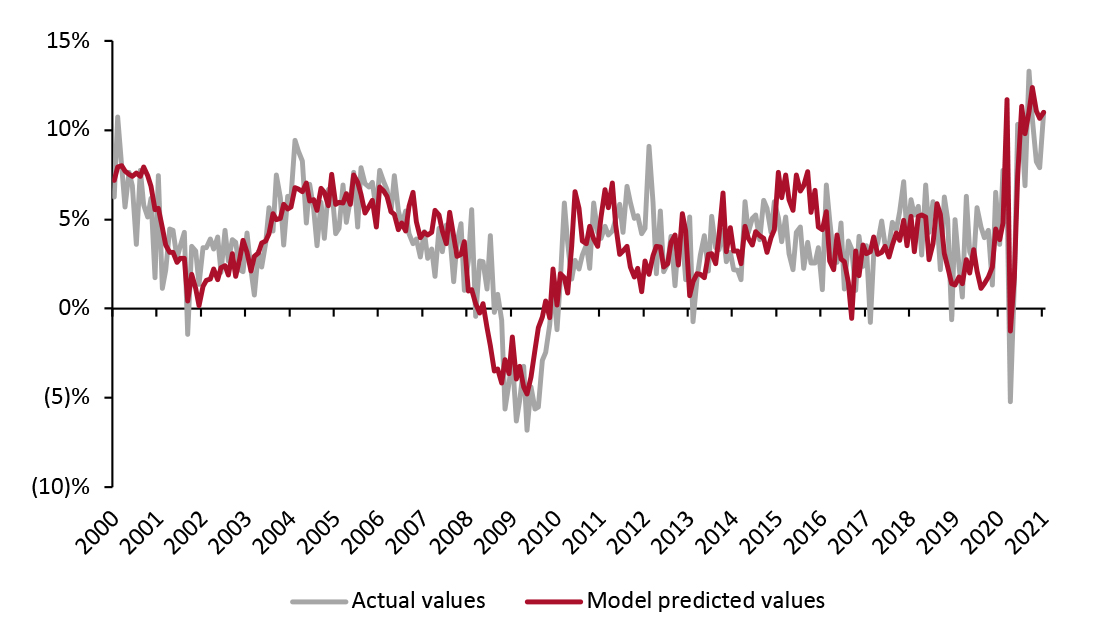 Source: BEA/BLS/Federal Reserve Board of Governors /S&P/Coresight Research[/caption]
In April, retail sales kept pace with a very strong March. While March sales were driven in large part by a third round of stimulus checks, April sales were boosted not just by the residual effects of these payments but also by rising vaccination rates, easing Covid-19 restrictions and growing consumer confidence. We expect these three trends to continue, keeping consumer spending very strong through the summer. The challenge that retailers will face will be in ensuring that even as consumers return to service and experience spending, spending on goods does not fall. In light of these health and behavioral trends, we examine major macroeconomic indicators to outline what the coming months in sales will look like.
Source: BEA/BLS/Federal Reserve Board of Governors /S&P/Coresight Research[/caption]
In April, retail sales kept pace with a very strong March. While March sales were driven in large part by a third round of stimulus checks, April sales were boosted not just by the residual effects of these payments but also by rising vaccination rates, easing Covid-19 restrictions and growing consumer confidence. We expect these three trends to continue, keeping consumer spending very strong through the summer. The challenge that retailers will face will be in ensuring that even as consumers return to service and experience spending, spending on goods does not fall. In light of these health and behavioral trends, we examine major macroeconomic indicators to outline what the coming months in sales will look like.
Leading Indicators of US Retail Sales: In Detail
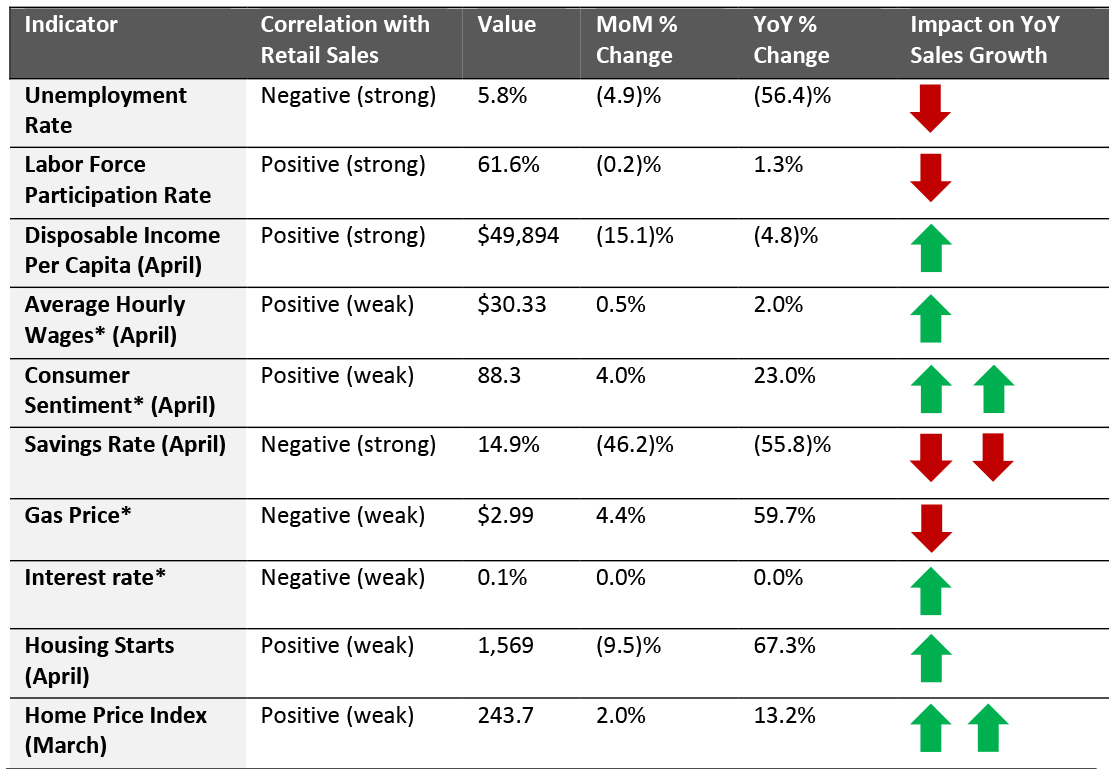
Indicators Overview Of the 10 indicators we examined, six are likely to have a positive impact on retail sales in the coming months. May’s jobs report was much stronger than April’s disappointing update, while disposable income remains high with help from government programs. Even in the face of a labor shortage, unemployment remains high, but is trending down as businesses across nearly every industry struggle to fill openings.Figure 2. US: Leading Indicators of Retail Sales, as of the End of May 2021 [caption id="attachment_128553" align="aligncenter" width="725"]
 Latest available data from May unless otherwise indicated
 *Not included in predictive model
Source: BEA/BLS/Federal Reserve Board of Governors /S&P/University of Michigan/US Energy Information Administration/Coresight Research [/caption] Looking ahead to soon-to-be-reported May sales (at the time of publication) and projected sales in June, we predict that retail sales will increase by 14.3% year over year, as illustrated in Figure 3, just below March’s 17.3% growth and far below April’s 28.5% growth (although this was inflated by weak 2020 comparatives).
Figure 3. US Retail Sales ex. Auto and Gas (YoY % Change) [caption id="attachment_128554" align="aligncenter" width="725"]
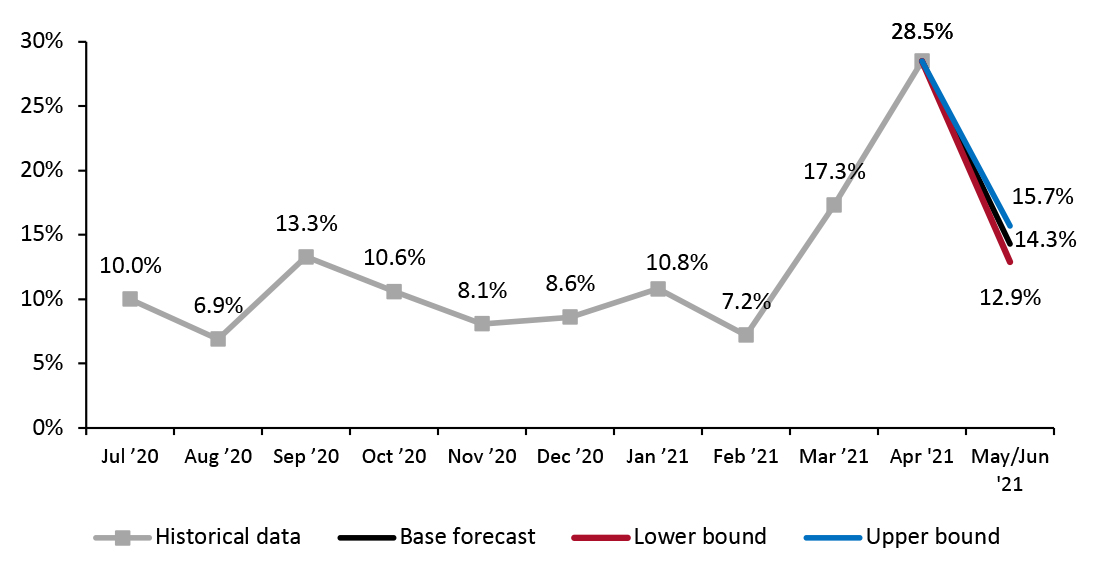 Source: BEA/BLS/Federal Reserve Board of Governors /S&P/Coresight Research[/caption]
The Job Market
The narrative around the job market has flipped in recent months, with businesses now struggling to fill vacancies. Generous federal unemployment benefits (which some states have begun to reject), high levels of savings, health concerns and care obligations have contributed to this labor shortage.
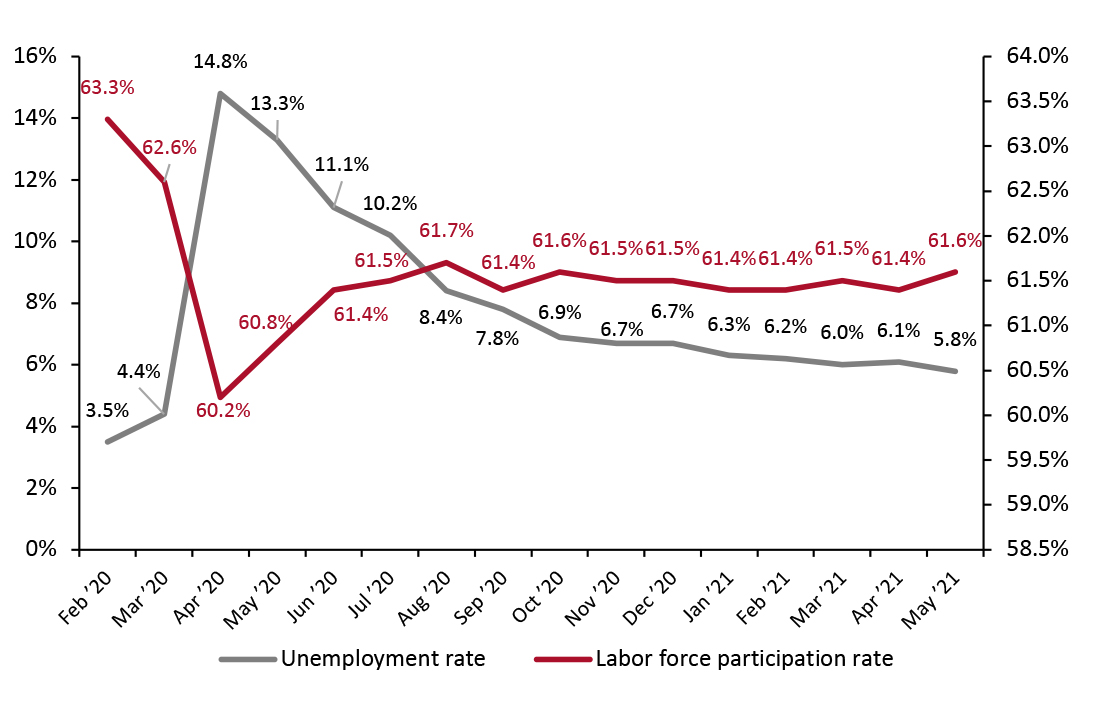
In May, however, we did see some progress back toward pre-pandemic employment levels. The unemployment rate dropped from 6.1% to 5.8%, the largest single-month drop since January. Equally encouragingly, the labor force participation rate rose to 61.6%, the largest jump since October 2020 (although still nearly two percentage points down from pre-crisis levels). In the near future, the labor force participation rate may be more important to watch than the unemployment rate—recovery in the labor market now hinges on drawing workers back to jobs rather than on job creation.
Source: BEA/BLS/Federal Reserve Board of Governors /S&P/Coresight Research[/caption]
The Job Market
The narrative around the job market has flipped in recent months, with businesses now struggling to fill vacancies. Generous federal unemployment benefits (which some states have begun to reject), high levels of savings, health concerns and care obligations have contributed to this labor shortage.
In May, however, we did see some progress back toward pre-pandemic employment levels. The unemployment rate dropped from 6.1% to 5.8%, the largest single-month drop since January. Equally encouragingly, the labor force participation rate rose to 61.6%, the largest jump since October 2020 (although still nearly two percentage points down from pre-crisis levels). In the near future, the labor force participation rate may be more important to watch than the unemployment rate—recovery in the labor market now hinges on drawing workers back to jobs rather than on job creation.
Figure 4. US Unemployment Rate (Left Axis, %) and Labor Force Participation Rate (Right Axis, %) [caption id="attachment_128555" align="aligncenter" width="725"]
 Source: BLS[/caption]
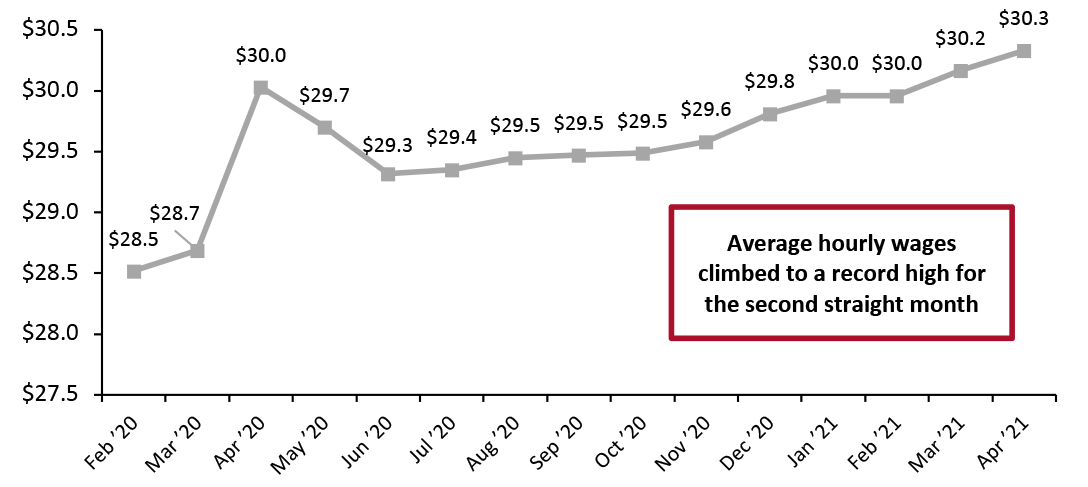
Average hourly wages across all private-sector employees rose this month to $30.33, setting a record high for the second straight month. Companies including Amazon and Under Armour have recently announced wage rises for their employees, encouraging workers to rejoin the labor force. These companies and others, however, are also facing increasing supply costs, creating a tension between offering competitive wages and maintaining supply and current prices—a tension that will only elevate inflation fears.
Source: BLS[/caption]
Average hourly wages across all private-sector employees rose this month to $30.33, setting a record high for the second straight month. Companies including Amazon and Under Armour have recently announced wage rises for their employees, encouraging workers to rejoin the labor force. These companies and others, however, are also facing increasing supply costs, creating a tension between offering competitive wages and maintaining supply and current prices—a tension that will only elevate inflation fears.
Figure 5. US Average Hourly Wages, All Private-Sector Employees (USD) [caption id="attachment_128556" align="aligncenter" width="725"]
 Source: BLS[/caption]
Implications
Labor market recovery appears back on track after a disappointing April but now faces the new challenge of a shortage of workers. The bottom line for retailers: Low employment numbers are now by the choice of the consumer and are likely not having such a negative impact on consumer spending as they were for most of the pandemic. However, as unemployment benefits expire and consumers use up savings accumulated during the pandemic, many more are likely to seek employment.
Income, Savings and Sentiment
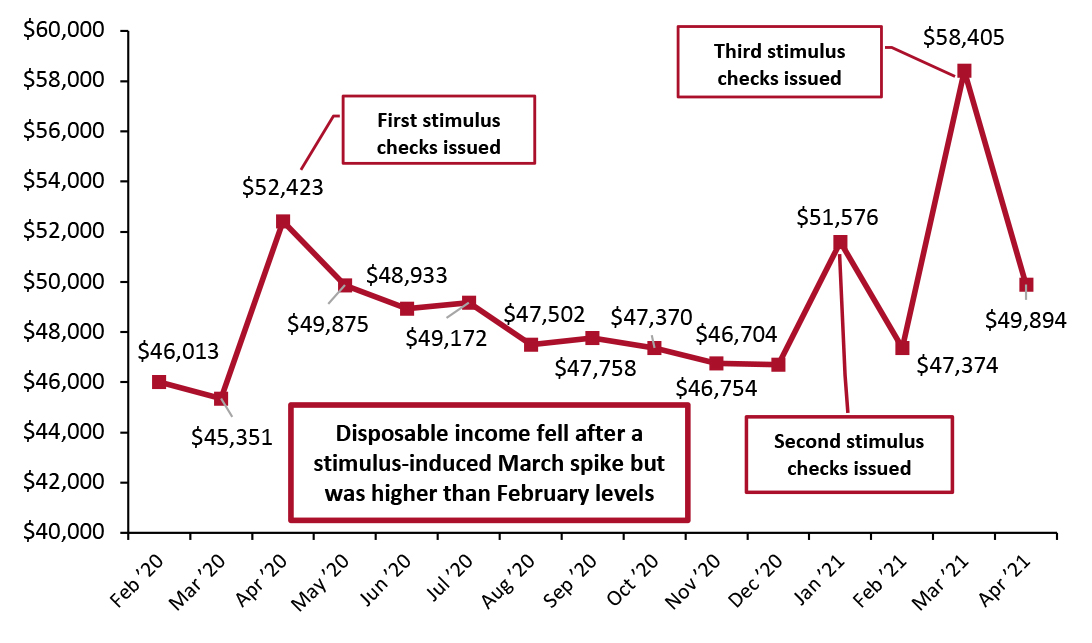
Following the expected stimulus-driven spike in March, real disposable income per capita fell substantially in April, to $49,894. However, this level still sat much higher than February’s $47,374, the last month without a stimulus check. Ignoring months that included stimulus, real disposable income per capita is trending up for the first time since the start of the pandemic, and has risen by more than $3,000 since December 2020, on an annualized basis.
Source: BLS[/caption]
Implications
Labor market recovery appears back on track after a disappointing April but now faces the new challenge of a shortage of workers. The bottom line for retailers: Low employment numbers are now by the choice of the consumer and are likely not having such a negative impact on consumer spending as they were for most of the pandemic. However, as unemployment benefits expire and consumers use up savings accumulated during the pandemic, many more are likely to seek employment.
Income, Savings and Sentiment
Following the expected stimulus-driven spike in March, real disposable income per capita fell substantially in April, to $49,894. However, this level still sat much higher than February’s $47,374, the last month without a stimulus check. Ignoring months that included stimulus, real disposable income per capita is trending up for the first time since the start of the pandemic, and has risen by more than $3,000 since December 2020, on an annualized basis.
Figure 6. US Annualized Real Disposable Income Per Capita (USD) [caption id="attachment_128557" align="aligncenter" width="725"]
 Source: BEA[/caption]
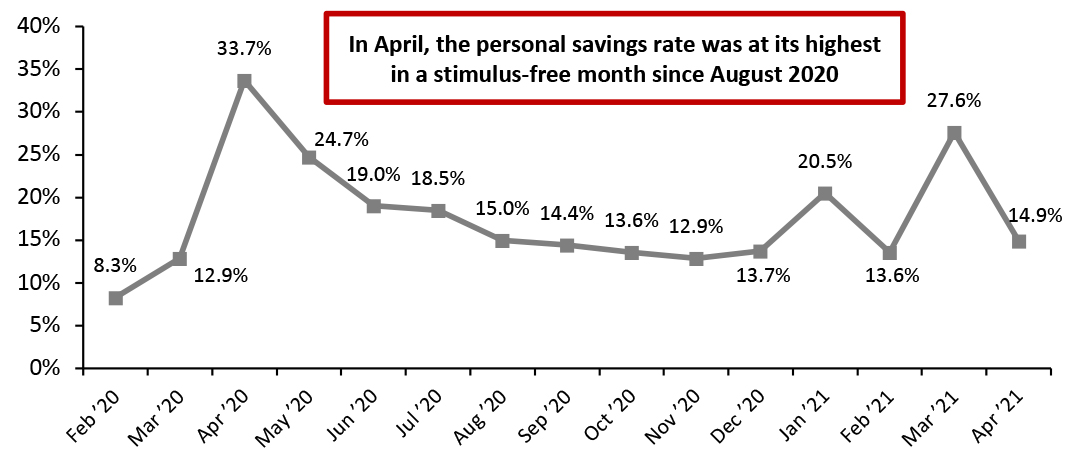
With every round of stimulus checks, the personal savings rate and real disposable income per capita have risen and then dropped the following month. The same pattern held in April, with the savings rate falling to 14.9%—still the highest rate seen in a non-stimulus month since August 2020, and nearly double the figure from before the pandemic.
The savings rate likely sat higher in April due to March’s stimulus checks being larger than those issued in January. In May and June, we expect to see slight declines in the savings rate as stimulus checks fade into the background and consumers become more eager to spend on experiences in what we expect to be a very strong summer.
Source: BEA[/caption]
With every round of stimulus checks, the personal savings rate and real disposable income per capita have risen and then dropped the following month. The same pattern held in April, with the savings rate falling to 14.9%—still the highest rate seen in a non-stimulus month since August 2020, and nearly double the figure from before the pandemic.
The savings rate likely sat higher in April due to March’s stimulus checks being larger than those issued in January. In May and June, we expect to see slight declines in the savings rate as stimulus checks fade into the background and consumers become more eager to spend on experiences in what we expect to be a very strong summer.
Figure 7. Personal Savings Rate (%) [caption id="attachment_128558" align="aligncenter" width="725"]
 Source: BEA[/caption]
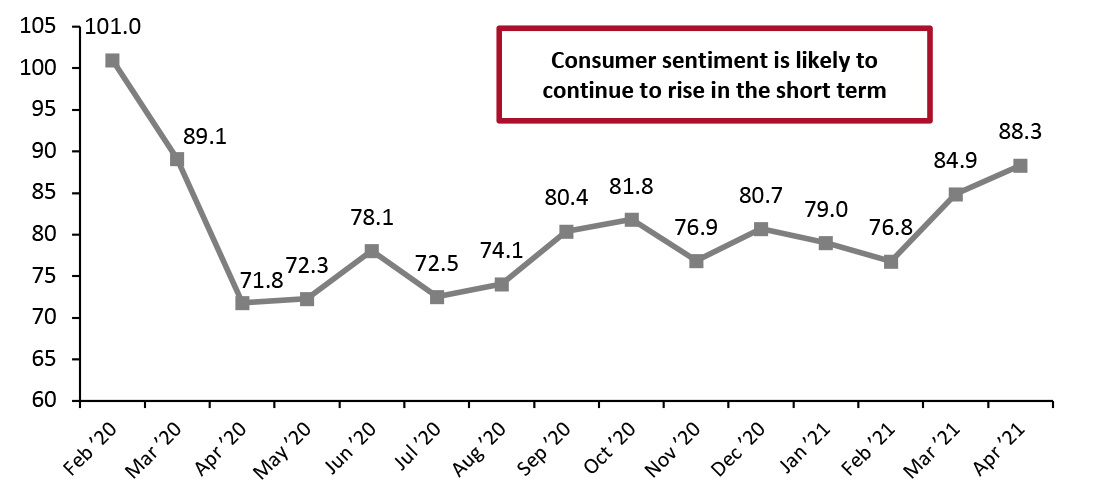
Consumer confidence rose for the second straight month in April, the first time since October 2020 that it has risen for consecutive months. While still substantially lower than pre-pandemic levels, consumer confidence is now 11.5 points higher than February 2021, reflecting consumers’ improving economic conditions and reduced concerns around Covid-19.
However, new concerns for consumers may be on the horizon: Inflation fears have more merit as wages and prices rise. Supply issues could also concern consumers. In recent earnings calls, many electronics manufacturers and retailers have expressed concerns over microchip shortages that may affect them for up to two years. In addition, delays at major ports are challenging supply chains in other industries. The inability to get the products they want when they want them could negatively impact consumer confidence, but the massive boost given to consumers by the taming of the virus is likely to outweigh these concerns—at least, for now.
Source: BEA[/caption]
Consumer confidence rose for the second straight month in April, the first time since October 2020 that it has risen for consecutive months. While still substantially lower than pre-pandemic levels, consumer confidence is now 11.5 points higher than February 2021, reflecting consumers’ improving economic conditions and reduced concerns around Covid-19.
However, new concerns for consumers may be on the horizon: Inflation fears have more merit as wages and prices rise. Supply issues could also concern consumers. In recent earnings calls, many electronics manufacturers and retailers have expressed concerns over microchip shortages that may affect them for up to two years. In addition, delays at major ports are challenging supply chains in other industries. The inability to get the products they want when they want them could negatively impact consumer confidence, but the massive boost given to consumers by the taming of the virus is likely to outweigh these concerns—at least, for now.
Figure 8. University of Michigan Consumer Sentiment Index [caption id="attachment_128559" align="aligncenter" width="725"]
 Source: University of Michigan[/caption]
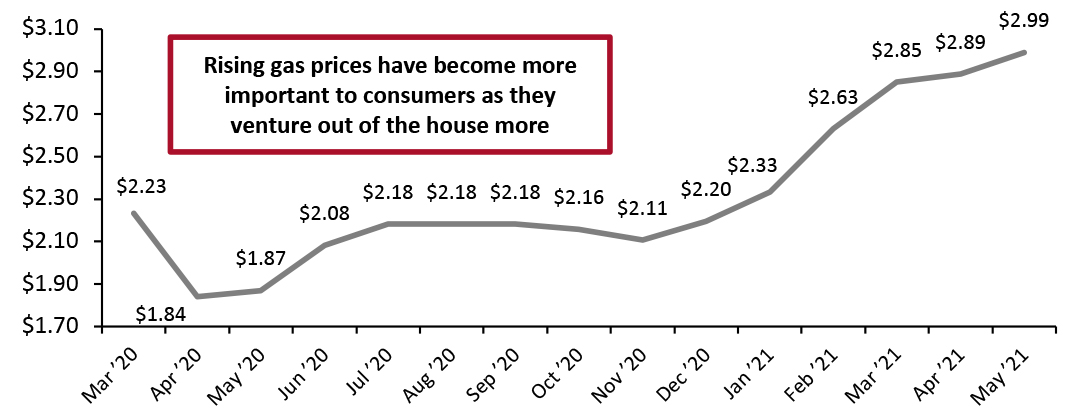
Gas prices have risen dramatically, stoking concerns around inflation. Gas prices have now risen for six consecutive months, to $2.99 as of the end of May—41.7 higher than in November 2020 (an increase of $0.89 per gallon) and 3.5% higher than in April 2021 (an increase of $0.10 per gallon).
Source: University of Michigan[/caption]
Gas prices have risen dramatically, stoking concerns around inflation. Gas prices have now risen for six consecutive months, to $2.99 as of the end of May—41.7 higher than in November 2020 (an increase of $0.89 per gallon) and 3.5% higher than in April 2021 (an increase of $0.10 per gallon).
Figure 9. US Regular All Formulations Gas Price (Dollars per Gallon) [caption id="attachment_128560" align="aligncenter" width="724"]
 Source: US Energy Information Administration[/caption]
With consumers getting out and about more than any other time since the start of the pandemic, rising gas prices will have an exaggerated impact on their ability to spend on other products.
Implications
Despite a very high savings rate, we expect consumers to spend more freely in coming months. Consumer sentiment is likely to continue to rise. Consumers are returning to travel, restaurants and other service spending as virus fears fade. A rise in gas prices will put a slight dampener on spending, especially if last summer’s trend of more consumers traveling by car continues.
Housing
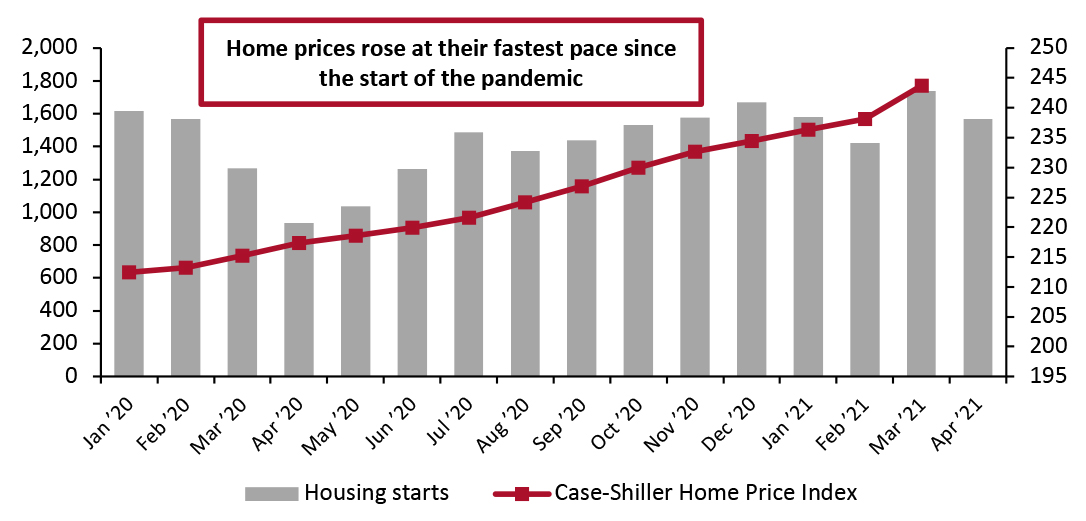
After a strong March, housing starts fell in April to closer to February 2021 values.
Home prices rose to record highs in March, the latest month for which data was available, with the Case-Shiller Index rising 5.6 points to 243.7, the largest single-month increase since the outbreak of the pandemic. These rising prices may slow starts moving forward.
Source: US Energy Information Administration[/caption]
With consumers getting out and about more than any other time since the start of the pandemic, rising gas prices will have an exaggerated impact on their ability to spend on other products.
Implications
Despite a very high savings rate, we expect consumers to spend more freely in coming months. Consumer sentiment is likely to continue to rise. Consumers are returning to travel, restaurants and other service spending as virus fears fade. A rise in gas prices will put a slight dampener on spending, especially if last summer’s trend of more consumers traveling by car continues.
Housing
After a strong March, housing starts fell in April to closer to February 2021 values.
Home prices rose to record highs in March, the latest month for which data was available, with the Case-Shiller Index rising 5.6 points to 243.7, the largest single-month increase since the outbreak of the pandemic. These rising prices may slow starts moving forward.
Figure 10. Housing Starts (Thousands, Left Axis) and Case-Shiller US Home Price Index (Right Axis) [caption id="attachment_128561" align="aligncenter" width="725"]
 Source: HUD/US Census Bureau[/caption]
The housing market faces two dueling forces: Low interest rates have made home buying attractive, while prices have been driven up to levels that many consumers cannot afford. It may not be immediate, but housing starts will begin to decline—if prices do not beat them to it.
Implications
We commented in the previous iteration of this report that home prices have been rising at an accelerating pace. That trend continued emphatically in the next month’s worth of data, with home prices rising at an even faster rate in March. Rising home prices will give consumers greater feelings of wealth and likely boost spending by homeowning consumers. However, the home-buying craze is likely to slow soon, as prices make it prohibitively expensive for many to purchase homes despite low interest rates. .
Source: HUD/US Census Bureau[/caption]
The housing market faces two dueling forces: Low interest rates have made home buying attractive, while prices have been driven up to levels that many consumers cannot afford. It may not be immediate, but housing starts will begin to decline—if prices do not beat them to it.
Implications
We commented in the previous iteration of this report that home prices have been rising at an accelerating pace. That trend continued emphatically in the next month’s worth of data, with home prices rising at an even faster rate in March. Rising home prices will give consumers greater feelings of wealth and likely boost spending by homeowning consumers. However, the home-buying craze is likely to slow soon, as prices make it prohibitively expensive for many to purchase homes despite low interest rates. .
What We Think
April retail sales were very strong, and increasing numbers of confident, wealthy and employed consumers look set to keep that strong spending going through the summer. Implications for Brands/Retailers- Despite unemployment numbers that are still elevated compared to pre-pandemic levels, retailers should not take unemployment figures at face value when determining how much consumers will spend. The current low labor force participation rate, unlike previously, is partly due to consumers’ accrued savings and continued benefits, and therefore does not preclude high consumer spending.
- Consumer confidence is rising fast and does not look likely to slow down, as consumers get back to normal behaviors and grow increasingly optimistic. In particular, these confident consumers’ return to travel should have positive benefits on retail, specifically apparel and luxury.
- Rising home prices, wages and commodity prices could lead to inflation. Smaller retailers may struggle to keep up with larger companies if it takes higher wages to attract employees.