DIpil Das
The Coresight Research US Retail Traffic and In-Store Metrics report reviews year-over-year changes in selected store-based metrics as reported by RetailNext. In this month’s report, we review store traffic changes through May, when nonessential businesses started to reopen across the country following the easing of coronavirus lockdowns. RetailNext’s coverage does not include food retailers but does include some other retail sectors deemed essential; the exclusion of food retail means the figures cited below almost certainly overstate recent declines in total retail traffic.
Weekly Shopper Traffic Trends
Weekly data for May tracks the progress of store closures over four weeks (May 3–May 30, 2020):
- The first week saw a decline of 89.9% as some states started to reopen malls and nonessential businesses.
- Declines decelerated to 86.2% in the second week and 81.2% in the third week.
- In the fourth week, traffic trends improved, with the decline at 76.5%, as more states began to lift shelter-in-place orders.
- Other than traffic, RetailNext did not publish the metrics for which it typically provides data, such as shopper yield and conversion rate.
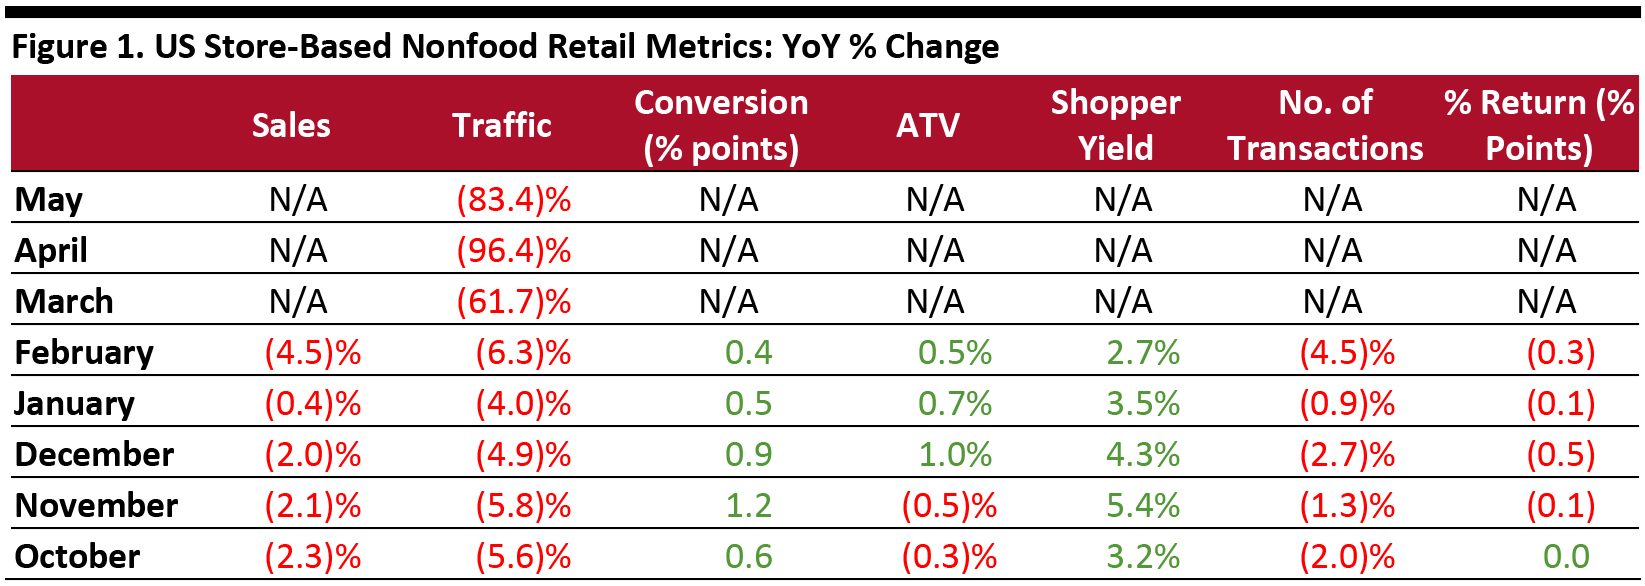 ATV = average transaction value, % return = percentage of goods returned to stores
 Source: RetailNext [/caption] Traffic by Retailer Vertical Nonessential retailers were severely impacted in March and April by temporary store closures due to Covid-19 lockdowns. Traffic improved in May, with most states authorizing retailers to reopen in stages, provided they met specific guidelines. However, performances varied across industry verticals in May:
- The apparel sector experienced the largest traffic decline at 92.8%, followed by the jewelry sector, which saw an 89.4% decrease in traffic.
- The home sector posted the lowest decline in traffic at 68.6%, while the footwear sector reported a traffic decline of 84.1%.
- The first week posted the greatest decline of 51.5%. In this week, many southern states were among the first to reopen.
- Declines lowered to approximately 46% in the second and third weeks as more retailers began to reopen. The Memorial Day Weekend (May 23–25) was in line with the second- and third-week performance.
- The positive trend of easing declines in traffic continued in the fourth week, closing the month out with a decline of 44.2%.
- The Northeast region saw the largest traffic decline of 93.4%, as many states were slow to reopen and as New York City and surrounding areas were considered the epicenter of the Covid-19 pandemic.
- The South posted the lowest decline in traffic at 74.7%, as this region included many states that were the first to lift restrictions. Memorial Day weekend performed best in this region, with traffic declines improving to 69.9%.
- The Midwest and West saw traffic decline at 83.9% and 84.4% respectively.
- Traffic by mall location type declined between 85% and 92%, with lifestyle centers modestly outweighing other store types.
- Strip malls managed to outperform other location types in May, with a decrease of 62.7%, up 15 percentage points as compared to non-mall street-front locations.
- Street-front stores outperformed other location types, dropping 77.6%; these freestanding stores were able to set their own hours and policies, unlike in malls.