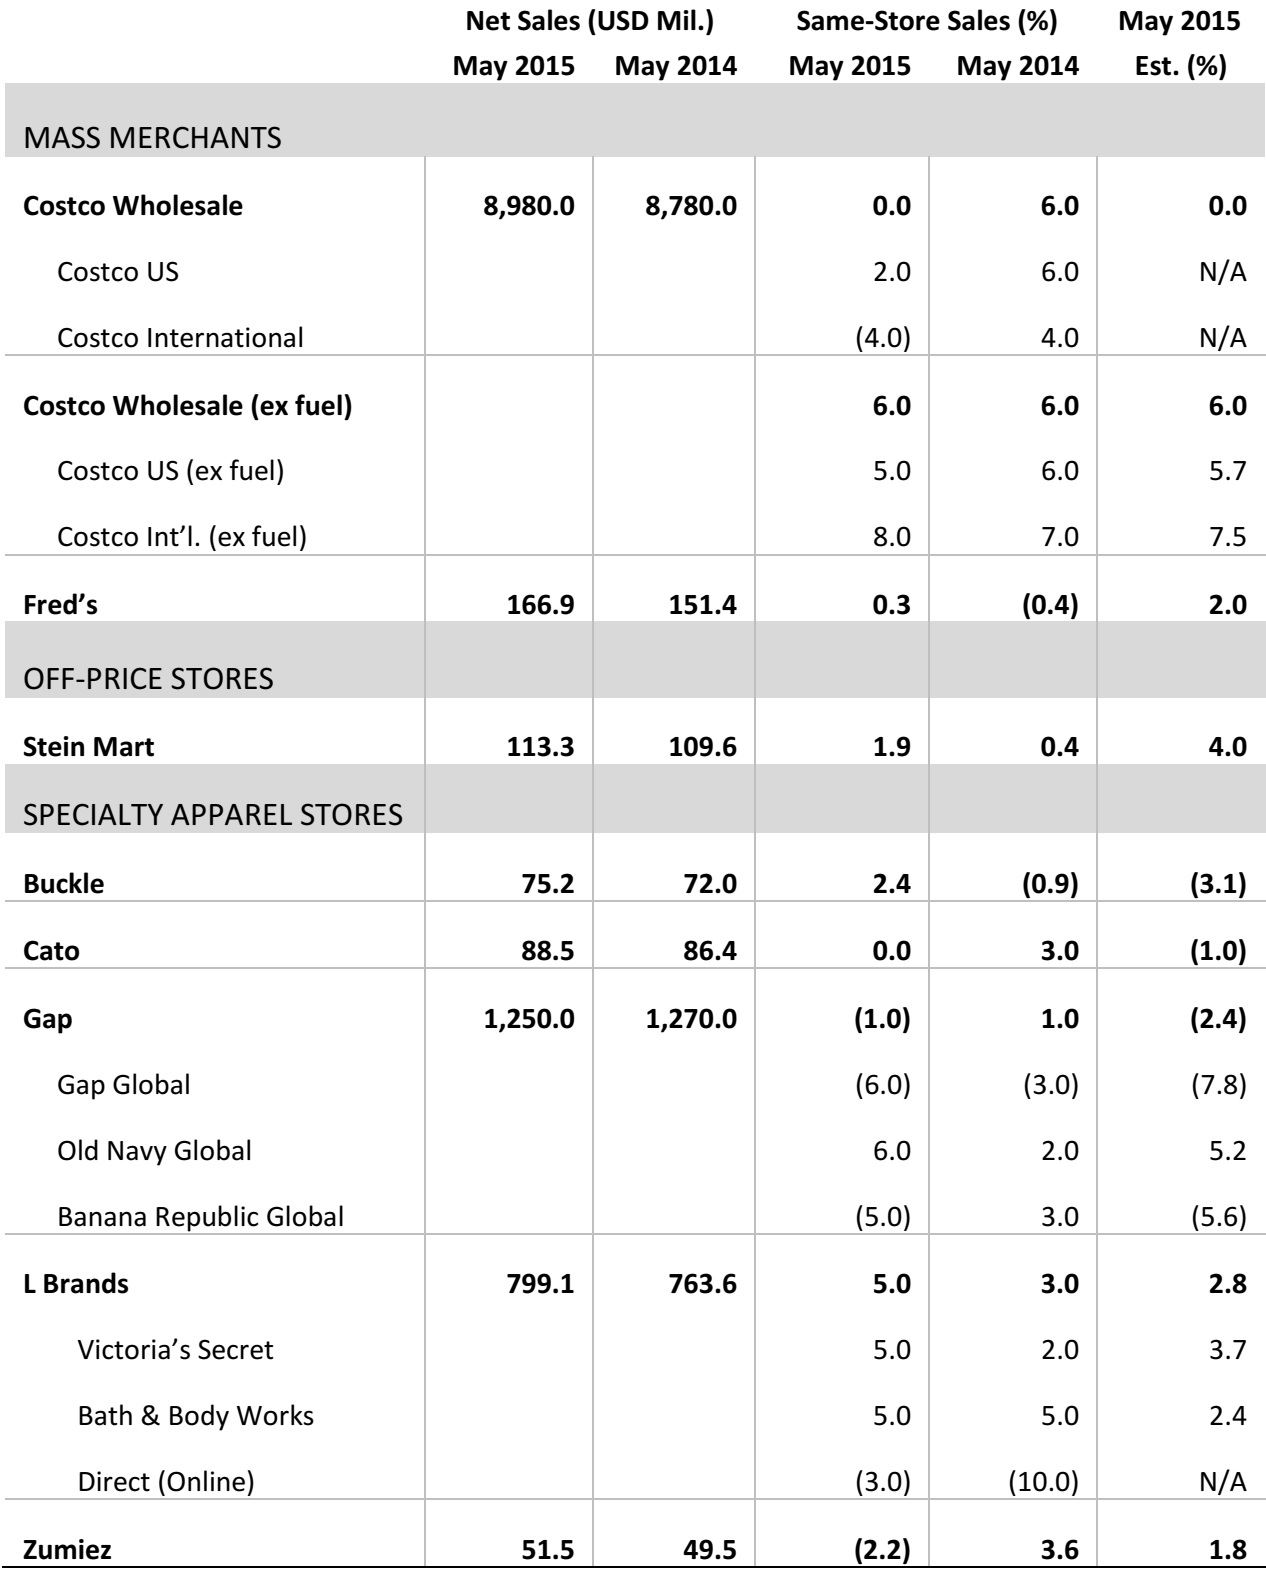
Costco’s Overall May Comp Flat, in Line with Estimates
- The four-week May period had 27 selling days this year and last year, reflecting Memorial Day in the US and Victoria Day in Canada.
- Costco’s flat comparable sales number was in line with analysts’ estimates. When excluding the impact of fuel, comp sales were up 6%.
- Within the US, the strongest sales regions were the Midwest and Los Angeles and San Diego. On the international side, Australia, Mexico and Taiwan posted strong sales.
- Food and sundries saw mid-single-digit comps. The deli, candy and frozen food subcategories had particularly strong results.
- In the hardline category, hardware and tires were the top performers, posting mid-single-digit sales. Domestics, home furnishings, apparel and small appliances were the best-performing softline categories.
- The fresh food category had mid-to-high-single-digit growth in May. The meat, service deli and produce subcategories had the strongest results.
Solid Sales Results in May at Value Store Fred’s
- Fred’s sales in May increased by 10% to $166.9 million. Excluding $6.1 million from last year’s 56 closed stores, total sales growth would have been 15%.
- Fred’s anticipates that June sales will benefit from a year-over-year calendar shift, and the company expects a positive cycle of double-digit growth for the rest of the year.
- Pharmacy expansion, general merchandising and supply chain initiatives are expected to drive higher sales and traffic in 2Q.
Stein Mart’s May Comps Missed Estimates Due to Bad Weather in California and Texas
- Stein Mart’s same-store sales in May grew by 1.9% versus last year, missing analysts’ estimates of 4% by a wide margin.
- Florida and the Mid-Atlantic states had the strongest sales, while California and Texas posted declines. Sales and traffic in California were affected by cooler weather. Record rain and flooding negatively impacted sales in Texas.
- Over 25% of Stein Mart’s stores are located in California and Texas.
Buckle Posted Strong May Sales, Driven by Similar Categories in Men’s and Women’s
- Teen retailer Buckle’s overall comps grew by 2.4%: women’s categories increased by 2% and men’s by 7.5%.
- The women’s section accounted for 55.5% of total monthly sales versus 57% last year. The total sales portion for men’s categories increased to 44.5% from 43% last year.
- Popular men’s categories included casual bottoms, denim, woven shirts and accessories. On the women’s side, casual bottoms, denim and woven tops were popular sellers.
Cato’s Flat May Comp Sales Stay on Trend, Beat Estimates
- Cato reported sales of $88.5 million for the four weeks ended May 30, 2015, up 2% from $86.4 million in May 2014.
- “May same store sales continued at our recent trend over the last several months at flat to last year,” said John Cato, Cato’s Chairman, President and CEO.
Gap Inc. Same-Store Sales Slid for Two of Three Divisions, but Beat Estimates
- Gap’s May comp sales were down 1%. The overall business declined by about $20 million in the same period.
- Old Navy continued to be the sales leader of the three divisions, posting the only positive sales growth: 6% versus 2% last year.
- Despite the May sales decline at Gap and Banana Republic, the two brands’ results beat estimates by 180 and 60 basis points, respectively.
L Brands Reports a 5% Increase in May Comps, Reflecting Strong Mother’s Day Performance for Bath & Body Works
- Comps were up 5% at both Victoria’s Secret and Bath & Body Works in May. Victoria’s Secret Direct sales declined by 3%, as significant growth in core categories was more than offset by the exit of apparel in this channel.
- Bath & Body Works benefited from strong Mother’s Day sales. In anticipation of semiannual sales in June, Bath & Body Works expects low-single-digit growth.
- The overall inventory per square foot was down 4% year over year, while the merchandise margin rate was up compared to last year.
Zumiez’s May Comps Declined by 2.2%, Driven by Slowed Domestic Business
- Zumiez’s 2.2% May comp decline compares with a 3.6% comp increase in May 2014, and results in a year-to-date 2015 comp gain of 1.8%.
- The May comp decrease was driven by a drop in comparable transactions, partially offset by an increase in dollars per transaction. Dollars per transaction rose reflecting an increase in average unit retail (AUR) and an increase in units per transaction (UPT).
In May, accessories, men's and footwear posted negative comps, while hardgoods and juniors posted positive comps.

