Nitheesh NH
Introduction
In this Market Outlook, we discuss the growth of the US consumer packaged goods (CPG) sector (also often called fast-moving consumer goods or FMCGs), key trends in both supply and demand, the online market and the competitive landscape. The categories included in the scope of this report include edible, which comprises the general food, refrigerated, frozen and beverage departments, and nonedible, which comprises the general merchandise, personal care, health and home care departments. Household care primarily consists of household and furniture cleaning supplies, such as dish detergent and laundry care products. The general merchandise department consists of nonedible fast-moving consumer products that are generally used in the home but are distinct from household cleaning products. Examples of items in this category include office products and lightbulbs.Market Performance and Outlook
Market Overview We expect the year-over-year growth rate in US CPG sales in 2022 to rise to 8.7% due to high inflation in input costs and logistics this year, which will drive price increases for consumers. The category will likely return to single-digit growth in the next few years as that tailwind abates, but it will remain above pre-pandemic growth levels due to lasting consumer behavior changes. In 2021, the $998.3 billion CPG market grew at a pace of 6.0% year over year, according to data from IRI; that expansion compounded the huge, Covid-driven jump in 2020, as consumers dined more at home and sought out hygiene and household cleaning products. Organic growth in 2022 will likely be tempered by supply chain problems, labor shortages and a dearth of raw materials. As many consumers may prefer to prepare their own food at home which is generally more budget friendly and healthy, we expect the higher than pre-pandemic rates of food-at-home expenditures seen during 2021 to last beyond 2022.Figure 1. US CPG Market Size (Left Axis; USD Bil.) and YoY % Change (Right Axis) [caption id="attachment_147138" align="aligncenter" width="701"]
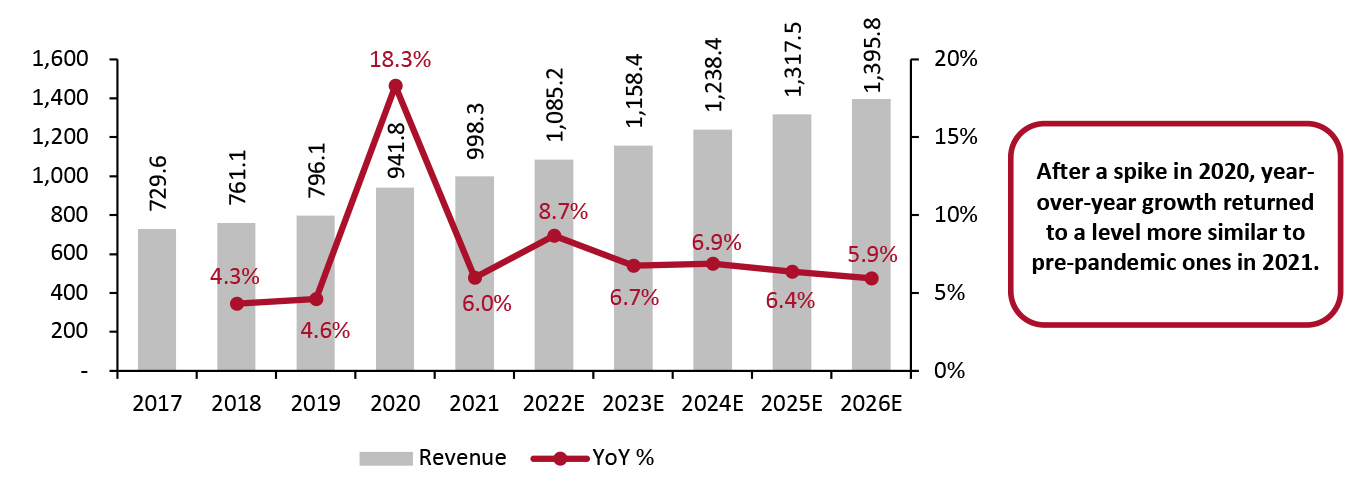 Market size includes total e-commerce CPG sales and store-based CPG sales by retailers in the grocery, convenience store, drugstore, mass merchandiser, warehouse club and dollar store sectors
Source: IRI/Coresight Research[/caption] Edible vs. Nonedible
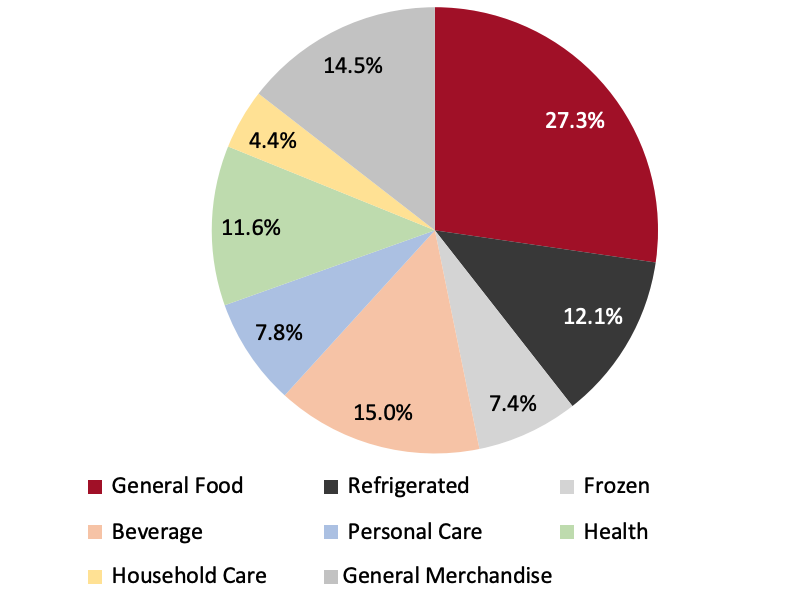
Figure 2. 2021 US CPG Market Breakdown [caption id="attachment_146283" align="aligncenter" width="700"]
 Source: IRI/Coresight Research[/caption]
Edible
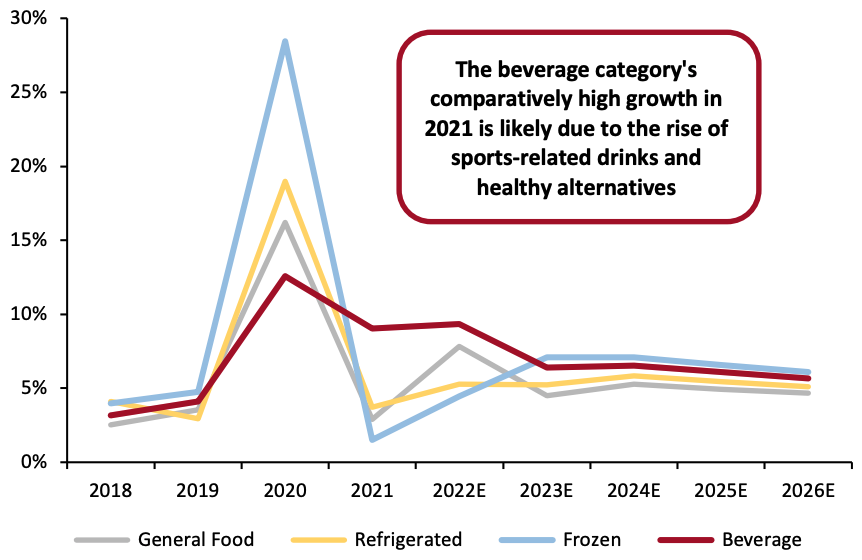
The edible segment holds the largest share of CPG market, amounting to 61.8%, and is divided into general foods, refrigerated, frozen food, and beverages. Growth in all three food categories slowed to single digits in 2021, but remained positive off strong double-digit comparatives in 2020. This suggests that some food-away-from-home spending is still being redirected toward food-at-home spending, albeit at lower levels than in 2020. This behavior was particularly sticky in the grocery categories of snack foods and fresh fruit and vegetables, particularly organic and/or sustainably produced products in 2021.
The beverage market remained strong in 2021, with a growth rate of 9.1% year over year, up from 12.6% year over year in 2020, according to data from IRI. Production in the carbonated soft drink (CSD) segment, one of the largest segments in the beverage market, appears to be on the decline due to consumer avoidance of high-sugar content drinks. This decline is partly offset by the growing popularity of energy soft drinks and sparkling water, according to IBIS World and Beverage Digest. This continuing health trend has led producers to innovate and use low-calorie natural sweeteners, such as stevia, fruit juice alternatives to sugar or artificial sweeteners. The popularity of energy soft drinks follows a trend of beverage hybridization, which is driven by demand for novel beverages and tastes, according to IBIS World.
Source: IRI/Coresight Research[/caption]
Edible
The edible segment holds the largest share of CPG market, amounting to 61.8%, and is divided into general foods, refrigerated, frozen food, and beverages. Growth in all three food categories slowed to single digits in 2021, but remained positive off strong double-digit comparatives in 2020. This suggests that some food-away-from-home spending is still being redirected toward food-at-home spending, albeit at lower levels than in 2020. This behavior was particularly sticky in the grocery categories of snack foods and fresh fruit and vegetables, particularly organic and/or sustainably produced products in 2021.
The beverage market remained strong in 2021, with a growth rate of 9.1% year over year, up from 12.6% year over year in 2020, according to data from IRI. Production in the carbonated soft drink (CSD) segment, one of the largest segments in the beverage market, appears to be on the decline due to consumer avoidance of high-sugar content drinks. This decline is partly offset by the growing popularity of energy soft drinks and sparkling water, according to IBIS World and Beverage Digest. This continuing health trend has led producers to innovate and use low-calorie natural sweeteners, such as stevia, fruit juice alternatives to sugar or artificial sweeteners. The popularity of energy soft drinks follows a trend of beverage hybridization, which is driven by demand for novel beverages and tastes, according to IBIS World.
Figure 3. US Edible CPG Categories YoY % Change [caption id="attachment_146284" align="aligncenter" width="700"]
 Source: IRI/Coresight Research[/caption]
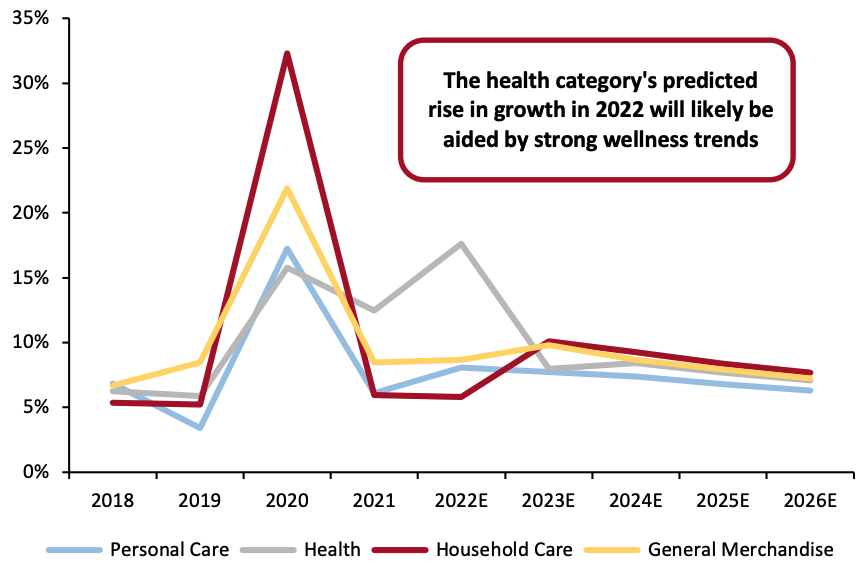
Nonedible
The nonedible categories make up 38.3% of the CPG market, and are composed of the household products, general merchandise, health, and personal care categories. Household product growth stood at 5.9% year over year in 2021, down from its high level of 32.3% year-over-year growth in 2020. The fastest growing household product categories in 2021 were pest control (up 37.1%), laundry care (up 22.7%), and cleaning tools/mops/brooms (up 16.5%). The sustainability trend also helped drive growth in the home care category, with various companies innovating to create products with environmentally friendly product containers, formulas and packaging.
General merchandise grew 8.5% year over year and follows a similar growth trend to household products. Conscious consumerism is on the rise, with consumers paying more attention to the sustainability of their products. Companies are transforming their products to meet their environmental and social goals. We expect more businesses to shift away from work-at-home models, which will drive down spending in the home care and general merchandise categories.
The health CPG category showed sustained growth at 12.4% year over year in 2021, just below the 15.8% in 2020. The sector is buoyed by spending on nutrition to improve preventive health and digestion/microbiome health, which are growing markets that are attracting the investment of top food CPG companies such as Nestlé and PepsiCo. We expect that the continued growth of telemedicine will increase spending on over-the-counter medicines in 2022. Personal care brands are increasingly moving towards organic or natural products due to the wellness trend and consumer concern about product sustainability.
Source: IRI/Coresight Research[/caption]
Nonedible
The nonedible categories make up 38.3% of the CPG market, and are composed of the household products, general merchandise, health, and personal care categories. Household product growth stood at 5.9% year over year in 2021, down from its high level of 32.3% year-over-year growth in 2020. The fastest growing household product categories in 2021 were pest control (up 37.1%), laundry care (up 22.7%), and cleaning tools/mops/brooms (up 16.5%). The sustainability trend also helped drive growth in the home care category, with various companies innovating to create products with environmentally friendly product containers, formulas and packaging.
General merchandise grew 8.5% year over year and follows a similar growth trend to household products. Conscious consumerism is on the rise, with consumers paying more attention to the sustainability of their products. Companies are transforming their products to meet their environmental and social goals. We expect more businesses to shift away from work-at-home models, which will drive down spending in the home care and general merchandise categories.
The health CPG category showed sustained growth at 12.4% year over year in 2021, just below the 15.8% in 2020. The sector is buoyed by spending on nutrition to improve preventive health and digestion/microbiome health, which are growing markets that are attracting the investment of top food CPG companies such as Nestlé and PepsiCo. We expect that the continued growth of telemedicine will increase spending on over-the-counter medicines in 2022. Personal care brands are increasingly moving towards organic or natural products due to the wellness trend and consumer concern about product sustainability.
Figure 4. US Non-Edible CPG Categories YoY % Change [caption id="attachment_146285" align="aligncenter" width="700"]
 Source: IRI/Coresight Research[/caption]
Market Factors
The key market forces that have impacted the CPG market include consumers’ lowered price elasticity, high inflation and production costs. The latter were exacerbated by rising costs of raw materials and packaging, agricultural shortfalls, labor shortages and issues pertaining to supply chain congestion. Price Elasticity Consumers retained some spending behaviors and showed themselves to be less price-sensitive, contributing to a strong 2021 despite declining stimulus funds. According to Unilever, its US consumers appear to be less price-sensitive than they were pre-pandemic in 2019. Likewise, Coca-Cola revealed that its products’ higher prices associated with elevated costs remain effective due to “lower-than-expected price elasticities.” However, we do not expect this price insensitivity to continue throughout 2022; spending on services will likely increase as social gatherings become more common. Lower price elasticities did protect many CPG companies’ margins from inflation, which is continuing to be severe in 2022. Inflation is soaring, as reflected in the Consumer Price Index jumping 8.5% year over year in March 2022, which included substantial price increases for gasoline and food, according to US Bureau of Labor Statistics. Inflation Food input cost inflation is expected to reach 8% in the first half of 2022 before moderating to 4% in the second half, according to IRI. Much of this inflation will be passed onto the consumer through a 5%–8% unit price jump by the first half of 2022, according to the same source. Several companies such as Procter & Gamble (P&G), Nestlé and Kellogg, among many others, have noted the impact of sustained inflationary pressures in every stage of their supply chains, from the purchase of raw materials to the price of fuel. Inflation will also have an impact on packaging costs, which are expected to rise 12%–13% in 2022, according to IRI. Packing materials, especially aluminium, are experiencing their highest costs since 2015, compounded by US tariffs on imported aluminium, according to the Federal Bureau of Statistics. Plastic packaging film and sheet manufacturing has also risen by 8.8% year over year in March 2022, on top of a 21.6% year-over-year increase in March 2021, according to Federal Reserve Economic Data. This increase is the largely the result of natural disasters that have hit petrochemical manufacturers in the US Gulf Coast, in addition to the aforementioned issues with inflation and supply chain issues. Labor Shortage and Logistics Challenges Labor shortages and other supply chain problems inhibited growth across various CPG categories. This includes issues of “absenteeism, high turnover, and labor strikes” involving over 1,400 workers at Kellogg. Likewise, Tyson Foods reported labor as a factor in increased production costs, while Coca-Cola also blames labor shortages as a capacity restraint. Lack of labor played a part in logistics challenges as well, although other elements such as tight transportation markets and capacity constraints also impacted CPG company revenues, according to P&G. Johnson & Johnson struggled with supply constraints in the US which impacted its Listerine product, leading to declines in its oral care category in the third quarter of 2021. Colgate-Palmolive also blamed global logistics for worsening raw material shortages and lengthening shipment times, which have driven up costs, especially as the company turned to air freight to fulfill consumer orders in the third quarter of 2021. Unfortunately, it appears that shipping congestion will continue until the end of 2022 in the likeliest scenario, according to estimates from the Royal Bank of Canada and IRI. Raw Material Prices The price of raw materials increased in 2021. Kimberly-Clark’s margins were impacted by continuously rising prices for resin and pulp in the third quarter. The company will likely continue to feel this pressure as prices are expected to stabilize at higher-than-anticipated levels. Costs are also rising for Henkel, which expected direct material costs to rise by percentages in the low-to-mid-teens in 2021, which is above previous expectations of a percentage increase in the low-teens. Colgate-Palmolive’s raw material costs rose by 5.1% year over year in the third quarter of 2021. These production costs have caused the upward trend of product prices, and although elasticities were low, we do not expect them to remain so during 2022. Prices in agriculture also increased, particularly impacting the edible categories of the CPG sector. Costs of butter, sugar and grains were up 15%, and soybeans and wheat prices were at their highest peak since 2014, according to the Commodity Research Bureau Foodstuffs Index. Corn, a key ingredient and input in gasoline and industrial products, rose to its highest point since 2013, according to the same source. Associated British Foods’ sugar production hinted at the reason for these high prices, as production declined from 1.19 million tons of sugar in 2020 to 0.90 million tons in 2021. Their sugar beet crop suffered from virus yellow contamination as well as unfavorable weather in Europe, and we suspect that extreme weather impacted the production of other crops.Online Market
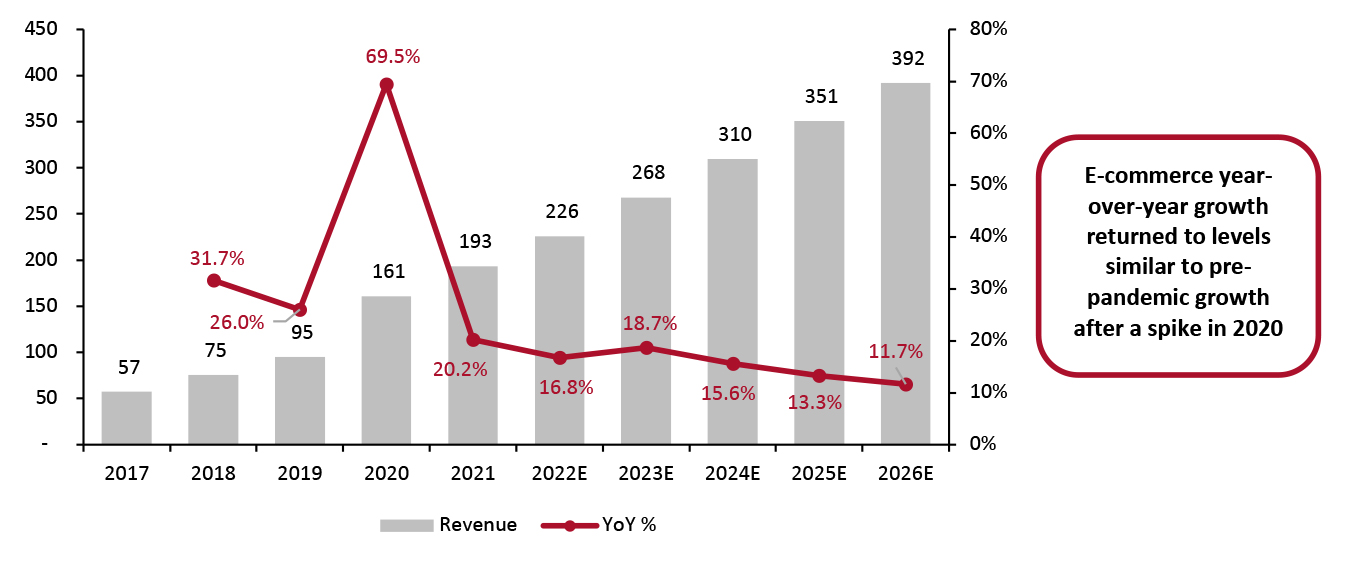
To combat all these downward market forces, CPG companies and the brands and retailers they own continue to turn to e-commerce to engage with consumers. While year-over-year growth in 2020 was 69.5%, pre-pandemic growth did not rise above 35%. We expect online growth will continue at double-digit growth rates, but gradually slow to the teens as e-commerce penetration rates approach saturation.Figure 5. US CPG Online Sales (Left Axis; USD Bil.) and YoY % Change (Right Axis; %) [caption id="attachment_147139" align="aligncenter" width="700"]
 Source: IRI/Coresight Research[/caption]
Figure 6. US E-Commerce Sales as a Percentage of Total Tracked Sales, by Category [caption id="attachment_147140" align="aligncenter" width="700"]
 Total e-commerce sales by category represented as a share of total sales tracked by IRI, which includes store-based sales by retailers in the grocery, convenience store, drugstore, mass merchandiser, warehouse club and dollar store sectors
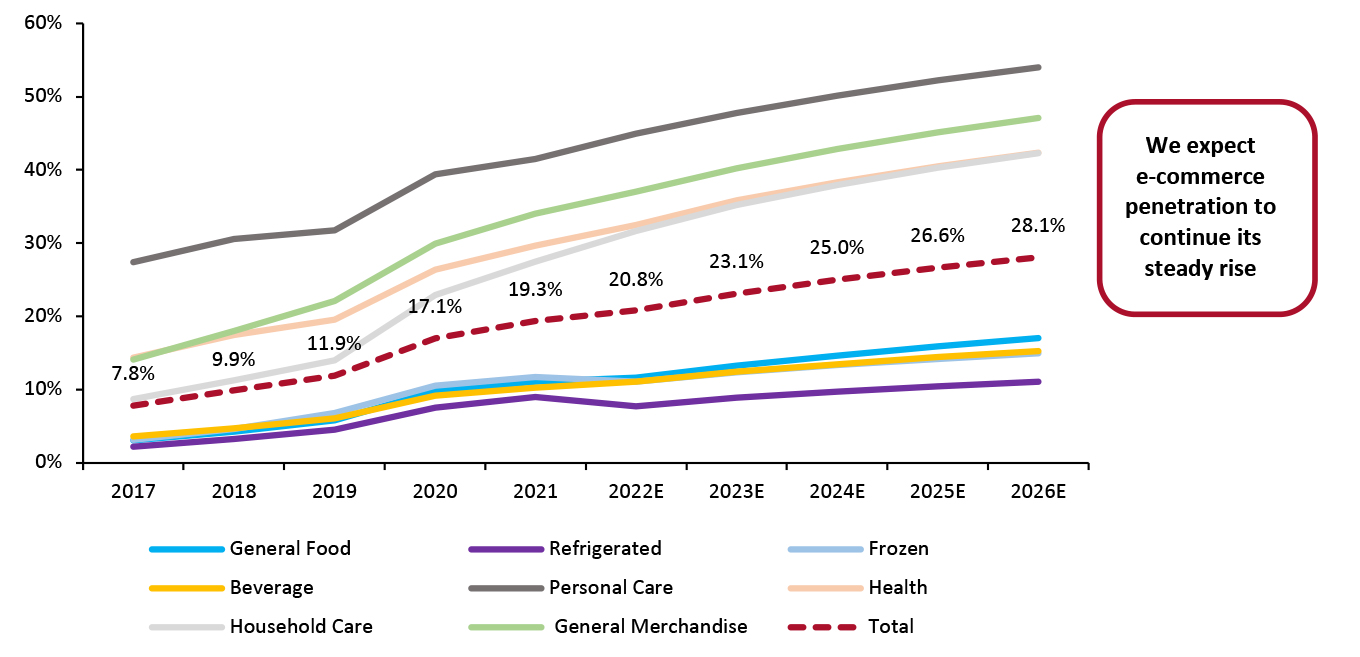
Source: IRI/Coresight Research[/caption] Online CPG continues to grow in share as it reached 19.3% of total tracked CPG revenue in 2021. The post-2020 trajectory suggests that total e-commerce penetration will grow steadily by low single digit percentage points. If this rate continues in 2022, e-commerce will equal an estimated 20.8% of total tracked CPG revenues.
Competitive Landscape
The US CPG landscape is dominated by several multinational companies that incorporate brands from a variety of sectors. The top 20 publicly traded CPG companies generated a total revenue of approximately $370 billion in 2021, which equates to approximately 37.1% of our CPG market size. These top companies often make products for more than one CPG category. For example, P&G owns brands such as Crest, Gillette and Tide. These companies span across the personal care and household goods categories. Likewise, although PepsiCo is known for its soft drink brands, the company also produces snack products that fall under the general foods category. As these CPG companies are well established, most have CAGR rates in the single digits, with a few dipping into the negatives between 2017–2021. However, 14 of the top 20 companies had 2021 growth rates that exceeded their CAGR rates, with 12 of these companies exceeding their CAGR rates by single or even double-digit percentage points. This suggests that 2021 was a favorable year for the CPG sector.Figure 7. Top 20 Public CPG Companies in the US: US Revenue (USD Bil.) [wpdatatable id=1925]
Does not include CPG companies that produce tobacco or liquor or private CPG companies such as Mars. Data are for fiscal years closest to calendar years; for some companies, fiscal years end early in the subsequent calendar year All values in USD, at 2021 conversion rates Source: Company reports/S&P Capital IQ/Coresight Research
Johnson & Johnson Johnson & Johnson is a multinational company with a consumer segment that spans the categories of over-the-counter consumer health, skincare, oral care, baby care, and wound care. Over-the-counter medicines have grown by 18.2% year over year, driven by sales of fever and other vaccination symptom relief products, such as Tylenol and Motrin. Other categories saw single digit declines largely due to shipping constraints and Covid-related lockdowns. Despite this, we expect that Johnson & Johnson’s sales will increase in 2022, aided by the strong wellness trend that promotes products with health and immune system benefits. The company also plans to increase its advertising expenditure to cement the consumer loyalty it gained during the pandemic. However, it is important to note that the company’s high rank in the list of CPG companies is partly due to the inclusion of its healthcare department which could not be extricated from CPG revenues. Nestlé Nestlé, the world’s largest food and beverage company, has expanded its investments in the health science category with a focus on nutrition and metabolism. The company has acquired core brands in 2021 such as Bountiful Company, which has aided the category’s double-digit returns. Another highlight for the company has been its online coffee offerings through its brands Nescafé, Nespresso, and Starbucks, which have been growing in the double digits, according to the company. Pet care also saw double-digit growth which was spurred by e-commerce sales. Procter & Gamble P&G is an American multinational consumer goods company that primarily offers products in the household goods and personal care categories. The company continues to focus on the development of sustainable products and has seen its market share increase in nine out of 10 categories (personal health, fabric care, baby care, feminine care and grooming, home care, oral care, hair care, skin care and personal care). Its e-commerce segment is a major growth driver, increasing 16% year over year in 2021. Like Johnson & Johnson, P&G is also planning to increase its advertising spend to communicate the benefits of its brands.Themes We Are Watching
Wellness Trend CPG companies are branching out or investing more in the health and wellness sector as consumers have become increasingly concerned with healthcare costs and warding off chronic diseases since the start of the pandemic in 2020. CPG companies have taken varied approaches to entering this market. Nestlé acquired nutrition and supplements maker Bountiful Company to focus on nutrition and metabolism, while Mondelez acquired keto-friendly chocolate brand Hu. These approaches show that companies planning to enter this space are not only targeting traditional over-the-counter nutritional supplements, but also wellness-oriented food products. Collaborations Consumers are becoming less loyal to brands. With the availability of more options through e-commerce, they are becoming more interested in trying new products and experiences. As a result, we are also seeing CPG companies striving to regain the attention of consumers, especially through collaborating with other brands and organizations to cross-promote their brands or products. Examples include Associated British Foods’ collaboration with Disney to promote a sustainable product, as well as the CPG company’s collaboration with the NBA and NFL in an assortment of sports categories. Mondelez International also activated its Oreo x Pokémon collaboration this year, which led the brand to achieve the fastest-selling edition in the US, according to the brand, and sparked a massive resale market for the limited-edition cookies. DTC Model The direct-to-consumer (DTC) online business model is gaining traction as one of the top ways to acquire customers and grew 16% year over year to an estimated $129.3 billion in 2021 in the US, according to Statista. The DTC market has become essential part of e-commerce as consumers desire a more personalized experience from the brands they purchase from. It benefits CPG companies by providing a means to collect first-party data and gain greater control over and flexibility in inventory. These advantages have allowed smaller brands to challenge CPG companies for market share in various product categories. In turn, established CPG companies are finding ways to adopt this business model into their existing brands or to purchase smaller brands that are already in this market. P&G has established its eco-oriented brand EC30 as a DTC platform, while PepsiCo has also found success in its this strategy, with its DTC sales nearly doubling in the third quarter of 2021. Most other CPG companies have chosen to join the DTC market by concentrating on the acquisition of small brands. Henkel launched coloration brands Palette and Syoss as well as styling brand got2b, which helped personalize the shopping experience for consumers. This has supported the company’s share gains. Likewise, Nestlé welcomed Bountiful Company into its core brands to facilitate Nestlé Health Science’s entry into the US DTC market. Reckitt Benckiser has also acquired and launched a series of brands, including Fight Vitamins, Little Yawn Collective and Casa Home, to compete in the DTC space.Retail Innovators
Innovative start-ups across the CPG categories understand the importance of creating products that are sustainable and beneficial to wellbeing without compromising their efficacy. By Humankind is a plastic-free personal care CPG business that is challenging other brands in its market with its high standards in sustainability and wellness. Its primary products include deodorant, shampoo and mouthwash. The company relies on a subscription-based refill model to supply consumers with the product for their pre-purchased product containers to cut down on single-use plastics. The company says that its deodorant product kills odor-causing bacteria 40% faster than other leading natural deodorants. Med-X is developing innovative, all-natural solutions to pest control under its Nature-Cide aid brand. This patented all-natural pest control formulation uses a blend of green, environmentally friendly essential oils that outperform top pest control products without the risks of poisonous exposure. The effectiveness of Nature-Cide was proven through a third-party study published in the Florida Mosquito Association’s journal, which found the brand to be the top-performing mosquito insecticide which outperformed the study’s top green competitor, Essentria IC3, as well as the top three biggest global sellers of synthetic pyrethroid mosquito insecticides. Nature-Cide is a registered pesticide with EPA offices in the 39 states that require it and has entered into a direct distribution deal with Pestmaster Services, another pest-control company that uses formulas with non-toxic or low-toxic EPA ratings MyForest Foods, formerly known as AtLast Foods, competes in the vegan meat market with its mycelium technology that can replicate whole-cut animal meats. Combined with fats, flavors and other ingredients, the company’s MyBacon product is often sold alongside real bacon in stores rather than beside other plant-based meat substitutes. The product is made with mycelium, which is rich in fiber, vitamins, and minerals, and is a good protein source with all nine essential amino acids. Growing and processing this ingredient takes only 13 days, which saves on the greenhouse gas emissions and time required to raise animals for slaughter. MyForest Foods is planning to expand production capacity with its partnership with Ecovative, a mycelium technology company, in order to supply CPG companies, food service businesses and the grocery industry with plant-based meats.What We Think
We expect that growth in 2022 will exceed pre-pandemic growth rates due to high inflation and sticky consumer behaviors. The trends in wellness and nutrition will likely continue to support spending on healthier products in the edible sector, while spending in the nonedible sector will favor products that are more sustainable. As companies have invested greatly in e-commerce during the past two years, we expect this area to grow even if future investments are limited. Implications for Brands/Retailers- Logistics constraints, labor shortages, raw material shortages and inflation are expected to continue throughout the first half of 2022, leading to reduced margins for brands and retailers. We encourage retailers to partner with each other to reduce transport uncertainties and logistics costs, as well as to maximize efficiency.
- Within the CPG sector, we also predict that innovation spurred on by collaborations and product combinations will continue to drive sales.
- The wellness trend will continue to drive sales in food products and over-the-counter medication.
- Larger CPG companies will likely continue to transition their brands toward a DTC business model to increase consumer loyalty. Alternatively, they may purchase smaller DTC brands to remain competitive.
Source for all Euromonitor data: Euromonitor International Limited 2022 © All rights reserved The information contained herein is based in part on data reported by IRI through its Market Advantage service for the Market Outlook: US Consumer Product Goods as interpreted solely by Coresight Research, Inc. The information is believed to be reliable at the time supplied by IRI but is neither all-inclusive nor guaranteed by IRI or Coresight Research, Inc. Without limiting the generality of the foregoing, specific data points may vary considerably from other information sources. Any opinions expressed herein reflect the judgment of Coresight Research, Inc. and are subject to change. IRI disclaims liability of any kind arising from the use of this information.