DIpil Das
US Retail Traffic and In-Store Metrics: March 2022
The Coresight Research US Retail Traffic and In-Store Metrics series reviews changes in selected store-based metrics, as reported by RetailNext. In this month’s report, we review store traffic changes through March 2022—which saw a decelerationn traffic growth at 16.5% compared to February’s 31.9% year-over-year increase, with trends affected by strong winter storms across the states. Year-over-year changes are our core metric for store-based data; however, due to Covid-19 all data in this report from March to July 2021 is compared to 2019 (pre-pandemic), because stores began closing in March 2020 and there were widespread store closures from April to July 2020. From August 2021 onward, the comparison is made on a year-over-year basis.- In March, ATV (average transaction value, or sales divided by transactions) increased by 4.5%, 3.4 percentage points lower than February’s growth of 7.9%, due to the impact of inflation which reduced the purchasing power of consumers.
- The conversion rate (sales transactions as a percentage of traffic) decreased by 2.2 percentage points in March, versus February’s 2.0 percentage points decline year over year.
- Shopper yield (sales divided by traffic) decreased by 3.1% in March, versus February’s 0.4% growth year over year.
- Unit per transaction (number of items purchased divided by number of transactions) decreased by 4.1% in March, higher than February’s 3.5% decline.
- Average unit retail (net sales divided by units sold) increased by 10.7% in March, lower than February’s 13.7% growth year over year.
Figure 1. US Store-Based Traffic and Sales: YoY % Change [caption id="attachment_145793" align="aligncenter" width="700"]
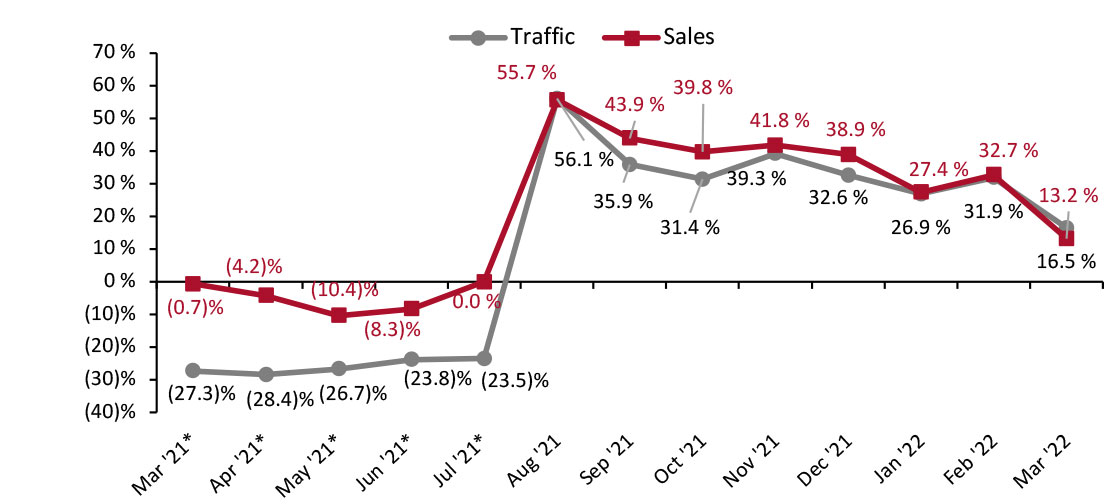 *March–July 2021 numbers are two-year % change due to store closures in the comparable period in 2020
Source: RetailNext [/caption]
Figure 2. US Store-Based Nonfood Retail Metrics: YoY % Change [caption id="attachment_145794" align="aligncenter" width="701"]
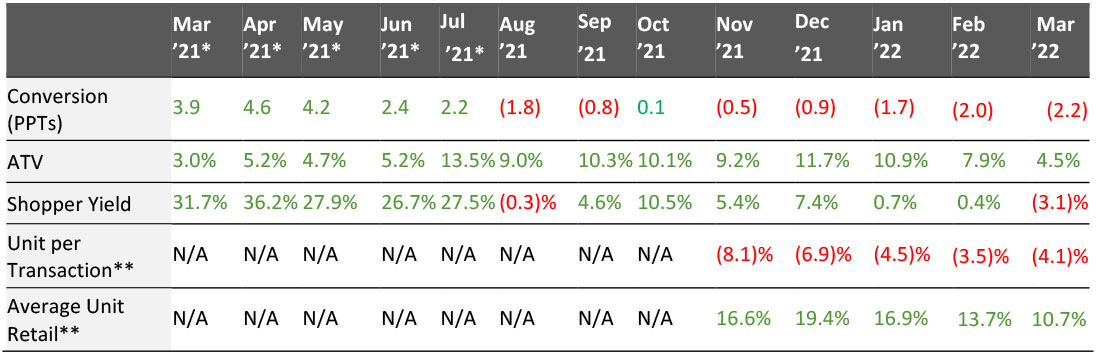 ATV=average transaction value; Shopper yield=Sales divided by traffic
 *March–July 2021 numbers are two-year % change due to store closures in the comparable period in 2020
**RetailNext started providing data on these from November 2021
Source: RetailNext [/caption] Weekly Shopper Traffic Trends Weekly data for March tracks the progress of store traffic over five weeks (February 27, 2022– April 2, 2022):
- In the first week of March, traffic was strongest compared to the other weeks. Traffic increased by 28.3% in the first week, a deceleration from February’s final week 39.7% growth.
- The third week of March witnessed a positive trend in traffic due to St. Patrick’s Day celebrated on March 17.
- As the month progressed, traffic performance showed a decelerating trend. The fifth week witnessed the lowest traffic trend of 6.2% due to the impact of winter storms across the states.
- Apparel was the strongest performing category in March, witnessing a 25.2% increase in traffic year over year. It was about 2,560 basis points (bps) lower than February. The first week witnessed best traffic trend in the apparel category.
- In March, health and beauty category performed second-best in traffic trends, increasing by 20.0% year over year, 1,030 bps lower than February.
- Footwear saw a traffic increase of 16.7% on a year-over-year basis, declining 1,230 bps from February. The footwear category saw a deterioration in traffic trends from the first week to the third week but saw an improvement in the fourth week.
- Traffic in the jewelry category increased by 15.7% year over year, declining 920 bps from February. The first week witnessed the best traffic trend in the jewelry category.
- The home category saw the softest growth compared to other categories. The home category recorded a 0.3% increase in traffic year over year, 1,500 bps lower than February.
Figure 3. US Retail Traffic by Industry Vertical: YoY % Change [caption id="attachment_145795" align="aligncenter" width="699"]
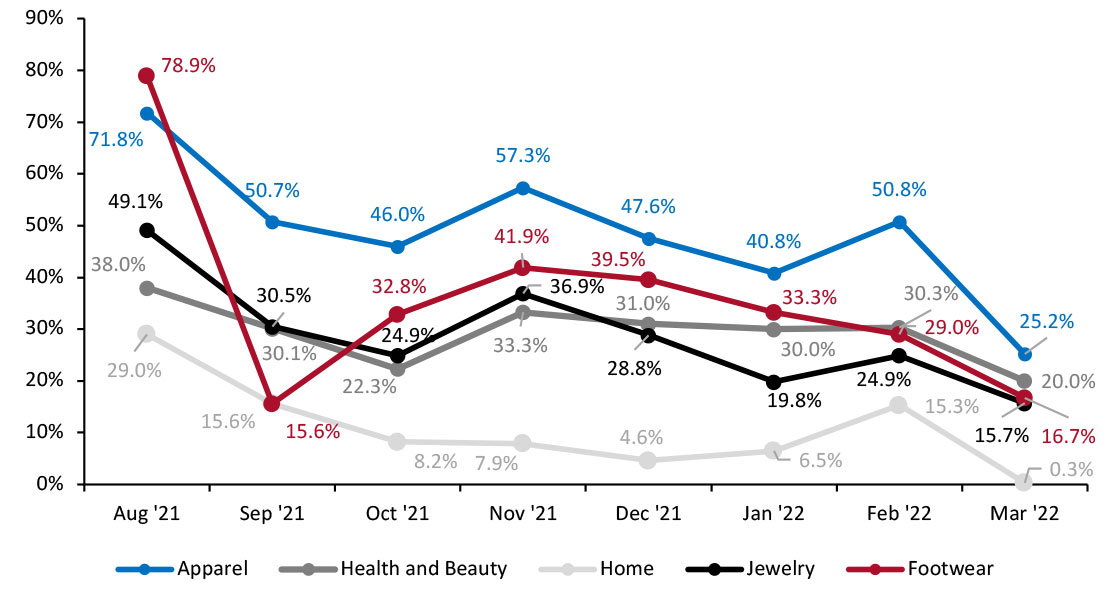 RetailNext started providing traffic trends by vertical on a year-over-year basis from August 2021
 Source: RetailNext [/caption] Regional Traffic Trends In the month of March, several states such as Hawaii, Oregon and Washington began to lift indoor mask mandates as the number of Covid-19 cases declined. At the end of the second week of March, the Northeast witnessed snow and strong winds due to a winter storm, impacting traffic trends. Traffic trends were also affected in multiple states across the South and Midwest due to damage and power outages caused by strong winds at the end of fifth week. Retail traffic in March varied across region.
- The West region was the best performer, as traffic increased by 20.8% year over year. Due to Hawaii lifting off its indoor mask mandates on March 25, the fourth week saw a positive trend in traffic compared to third week of March.
- The Northeast performed second-best with traffic increasing by 19.9% year over year. The second week witnessed a deterioration in traffic trends due to the impact of a late winter storm that brought high winds and snow. New York witnessed the lowest traffic trends in the second week.
- The South’s traffic increased by 12.3% year over year. The fifth week saw the weakest traffic trends due to storms which struck Alabama, Kentucky and Tennessee.
- In March, the Midwest region experienced the softest traffic trend, increasing by 6.6% year over year. Due to the impact of storms, the fifth week experienced the weakest traffic trends compared to other weeks. Indiana and Ohio witnessed the weakest traffic trends in the fifth week due to the impact of storms.
- Traffic by mall location type increased between 3.5% and 34.5% year over year.
- Other locations, including airports, casinos and hotels, outperformed all other location types, increasing by 34.5% year over year.
- Luxury locations performed second-best with traffic increasing by 32.1%, followed by traditional malls, which saw a 24.4% year-over-year rise in traffic.
- Street-front/freestanding locations saw a traffic increase of 24.2% while lifestyle centers saw traffic growth of 21.4% year over year.
- Outlet locations registered growth of 14.2% while strip malls saw traffic growth of 3.5% year over year.