DIpil Das
US Retail Sales: March 2022
Coresight Research’s measure of core retail sales is the unadjusted year-over-year change, excluding sales of gasoline, motor vehicles and parts. This metric took a steep fall in March as retail sales grew 4.0% from the year prior, down from February’s 13.1% revised year-over-year growth, according to the Census Bureau. March’s growth is in line with our expectation, published in our Leading Indicators of Retail Sales report. March’s 2022 retail sales estimates are against very strong March 2021 retail sales data when pandemic-driven stimulus checks proved a boost to retail spending. In a more positive light, 4.0% growth on top of 19.4% growth in March 2021 indicates that retail sales are healthy. However, 4.0% growth amidst a backdrop of high inflation points to a slowdown in consumer spending. In March, consumer prices increased 8.5% from a year earlier, a new 40-year high of inflationary growth. Price increases are being driven by essential goods, such as household energy, gasoline and food at home. While sales at gasoline stations are not included in our metric of retail sales, the price of gas is putting pressure on consumers’ ability to spend in discretionary categories. We estimate our retail-only inflation metric to be 8.1% in March, versus 7.5% in February (year over year). This metric strips out some of the core categories driving overall inflation and focuses on price increases within relevant retail-specific sectors, each of which are weighted to represent their share of total retail sales. With our inferred retail-only inflation metric at 8.1%, 4.0% overall growth in retail sales in March implies a real-terms sales decline of around 4.1%, year over year. Economic uncertainty is approaching on the horizon as the Federal Reserve Bank grapples with the task of raising interest rates fast enough to halt the 40-year high inflationary context. In March, the University of Michigan consumer sentiment index declined to 59.4, a year-over-year decline of 25.6%. It sat at its lowest level since August 2011.Figure 1. US Total Retail Sales ex. Gasoline and Automobiles: YoY % Change [caption id="attachment_145788" align="aligncenter" width="700"]
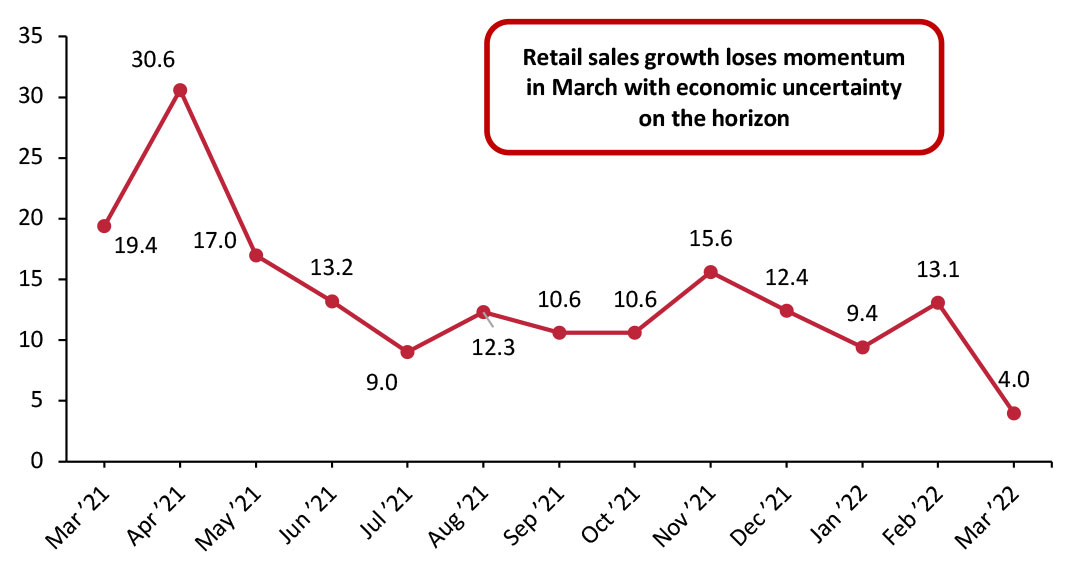 Data are not seasonally adjusted
 Source: US Census Bureau/Coresight Research [/caption] Seasonally adjusted retail sales, including automobiles and gasoline, grew 5.5% from a year ago. Sales at gasoline stations artificially surged as a result of higher prices. However, sales at motor vehicles and auto parts dealers declined year over year, reflecting the impact of the combination of the global microchip shortage and rising prices of new and used vehicles.
Figure 2. US Total Retail Sales incl. Gasoline and Automobiles: Seasonally Adjusted YoY % Change [caption id="attachment_145789" align="aligncenter" width="700"]
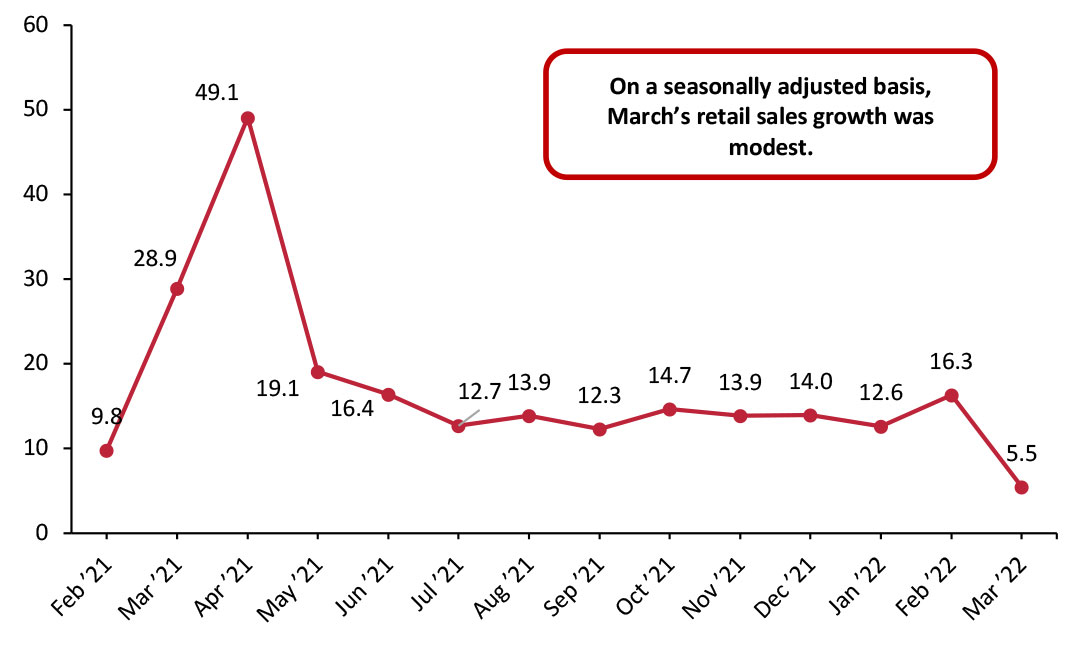 Data are seasonally adjusted
 Source: US Census Bureau/Coresight Research [/caption] Sales Did Not Grow Month over Month On a month-over-month basis, seasonally adjusted sales (excluding gasoline and automobiles) did not grow, while the Census Bureau’s revisions to February’s month-over-month decline changed it from an initial 1.0% decline to a more modest 0.7% sales decline.
Figure 3. US Total Retail Sales ex. Gasoline and Automobiles: MoM % Change [caption id="attachment_145790" align="aligncenter" width="700"]
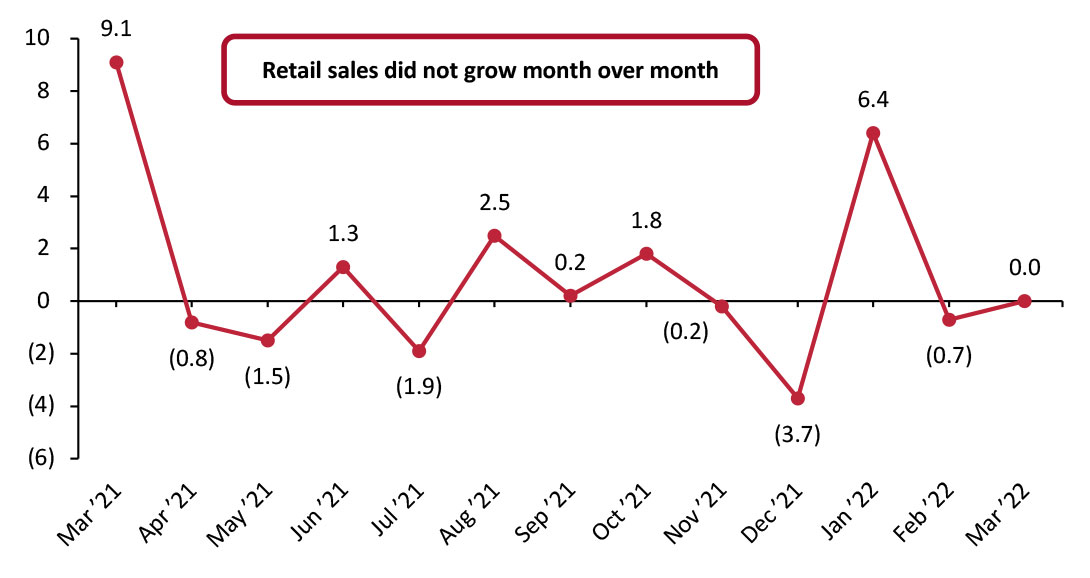 Data are seasonally adjusted
 Source: US Census Bureau/Coresight Research [/caption] Retail Sales Growth by Sector Overall retail sales growth lost momentum in March. While most sectors did post healthy months of sales growth, two notable sectors saw sales decline from a year ago.
- Sales at electronics and appliance stores declined 9.6% from a year ago, reflecting the tangible impact of the global microchip shortage.
- Sporting goods, hobby, musical instrument and bookstores saw sales decline by 5.7%, reflecting consumers’ inability to spend on hobbies within the current inflationary context.
- Sales at miscellaneous store retailers remained healthy, posting the highest sales growth of any sector in the month of March. Sales grew 14.3% from a year ago.
- Food and beverage stores sales grew a modest 7.9% while grocery store sales grew 9.0%. On the surface, these metrics appear healthy. However, consumer prices for food at home grew 10.0% in March. When accounting for inflation in this sector, sales actually declined.
- Sales at building material and garden supply dealers saw a sharp slowdown. Sales grew just 1.8% in March, down from February’s strong 14.4% growth. Sales slowdown in this sector is likely related to a slowdown in new home purchases, as mortgage rates have risen above 5.0% for the first time in over a decade, according to Freddie Mac.
- Similarly, sales of furniture and home furnishings lost momentum in March. Sales grew a modest 4.2% from a year earlier, falling from February’s 11.4% growth.
- Clothing and clothing accessory store sales were healthy; however, sales in this sector also markedly slowed. In March, sales grew 7.5%, down from February’s very strong 28.1% growth.
- Sales at general merchandise stores were modest, growing 3.9% from a year ago. The department store subsector grew sales by 3.3%, reflecting another vast slowdown from February’s 22.6% growth in sales.
- While it is not included in our definition of retail sales, the Census Bureau’s report of a 20.2% year-over-year rise in sales at food service and drinking establishments in March reflects the shift back to public places and services spending.
Figure 4. US Total Retail Sales, by Sector: YoY % Change [wpdatatable id=1907 table_view=regular]
Data are not seasonally adjusted Source: US Census Bureau/Coresight Research