Nitheesh NH
Introduction
What’s the Story? In our Leading Indicators of US Retail Sales monthly series, we examine several key macroeconomic indicators of US retail sales and analyze how they may impact the industry in the months to come. We analyze the latest available data as of March 22, from sources such as the US Census Bureau, the US Bureau of Economic Analysts (BEA), the US Bureau of Labor Statistics (BLS), the US Department of Housing and Urban Development (HUD) and the Federal Reserve Bank of St. Louis. Why It Matters Macroeconomic indicators have a significant impact on overall retail sales growth. Looking at 10 indicators (unemployment rate, labor force participation rate, disposable income per capita, average hourly wages, consumer sentiment, saving rate, gas price, federal funds rate, housing starts and housing prices), we can historically account for a majority of the variation in retail sales growth and create a strong basis for predicting sales moving forward. The close correlation between retail sales growth predictions based on economic indicators and actual retail sales growth is shown in Figure 1.Figure 1. US Actual Retail Sales ex. Auto and Gas Sales vs. Model Predicted Sales, January 2000–December 2021 (YoY % Change) [caption id="attachment_144327" align="aligncenter" width="700"]
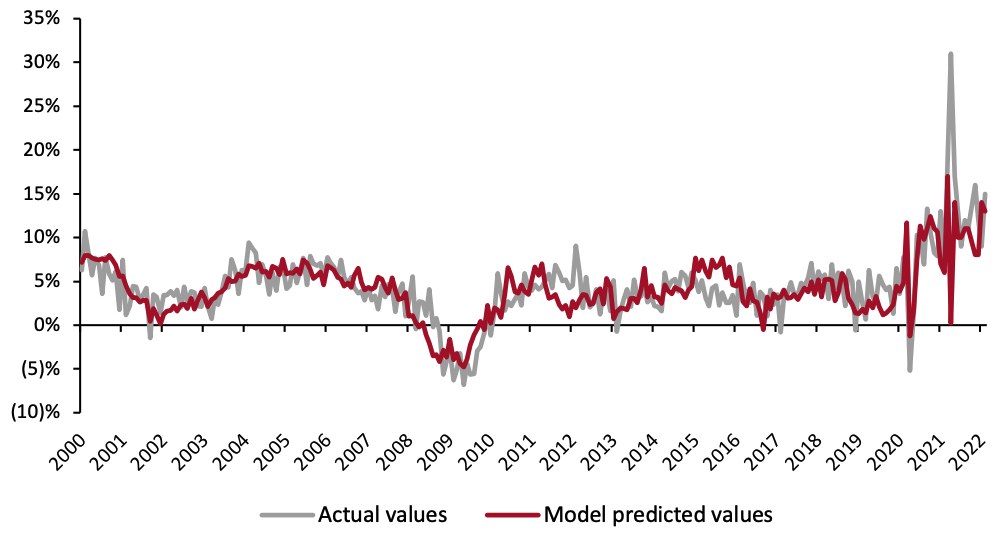 Source: BEA/BLS/Federal Reserve Board of Governors/S&P/Coresight Research[/caption]
So far in 2022, US retail sales have performed strongly as consumers have shown persistence in spending amid forty-year-high rates of inflation. In February, US retail sales grew 12.8% from a year earlier. However, we anticipate the Federal Reserve Bank’s interest rate hike and a further return to normality with increased spending on services and experiences will dampen retail sales growth in the months ahead.
Source: BEA/BLS/Federal Reserve Board of Governors/S&P/Coresight Research[/caption]
So far in 2022, US retail sales have performed strongly as consumers have shown persistence in spending amid forty-year-high rates of inflation. In February, US retail sales grew 12.8% from a year earlier. However, we anticipate the Federal Reserve Bank’s interest rate hike and a further return to normality with increased spending on services and experiences will dampen retail sales growth in the months ahead.
Leading Indicators of US Retail Sales: Coresight Research Analysis
Indicators Overview Of the 10 indicators we examined, five are likely to have a positive impact on retail sales in the coming months. In February, the unemployment rate ticked down further, while more workers joined the labor force. Average hourly wage growth slowed in February while disposable income continued a steady downward trend in January (latest available data). Consumer sentiment has fallen to its lowest point since September 2011, as already elevated gas prices have risen substantially over the course of past month in response to ongoing geopolitical developments. Inflation in aggregate remains high, and as a result, consumer sentiment has fallen back to near-record lows.Figure 2. US: Leading Indicators of Retail Sales, as of March 22, 2022 [caption id="attachment_144328" align="aligncenter" width="700"]
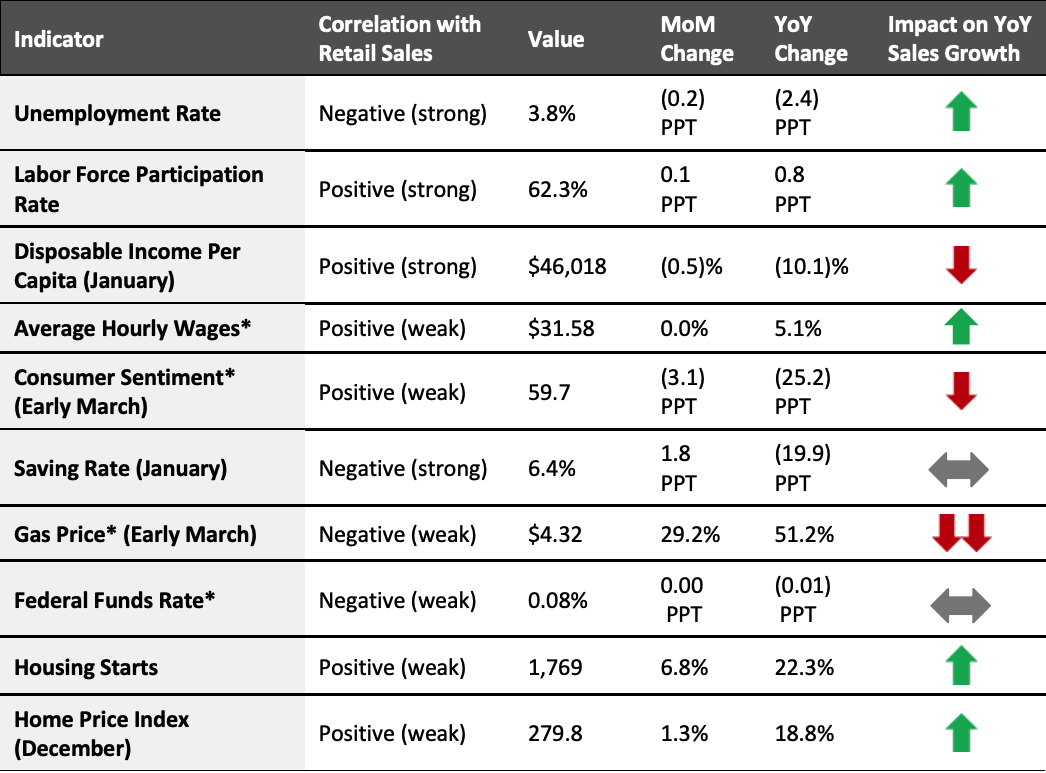 Latest available data from February unless otherwise indicated
*Not included in predictive model
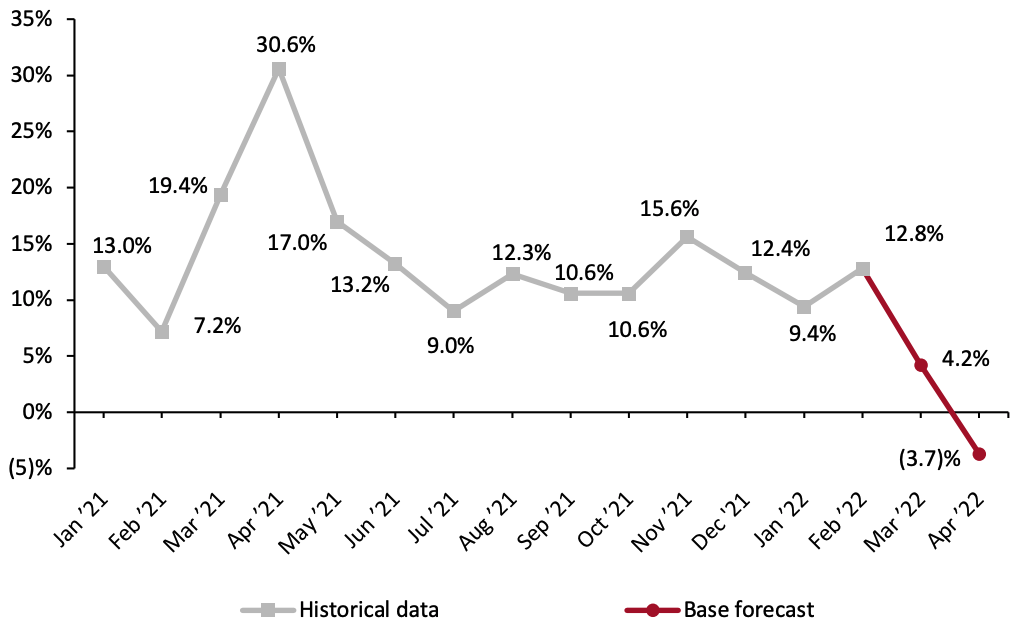
Source: BEA/BLS/Federal Reserve Board of Governors/S&P/University of Michigan/US Energy Information Administration/Coresight Research[/caption] Our model, which analyzes correlations between retail sales and macroeconomic indicators, generates a more modest outlook for March, predicting a 4.2% year-over-year growth in sales. Looking ahead to April, our model projects retail sales growth to be in negative territory, declining 3.7% from the previous year. These estimates are against unusually strong 2021 comparatives when the third round of stimulus checks resulted in a large boost to spending and elevated retail sales growth. In March 2021, US retail sales grew 19.4% from the previous year and in April 2021 sales grew 30.6% from the year prior. The sudden sales growth deceleration is in line with what we would expect against unusually strong 2021 comparatives. Even with that estimated 3.7% year-over-year decline, April 2022 retail sales would be over one-quarter ahead versus two years earlier—a two-year trend that is in line with that for recent months.
Figure 3. US Retail Sales ex. Auto and Gas (YoY % Change) [caption id="attachment_144329" align="aligncenter" width="700"]
 Source: BEA/BLS/Federal Reserve Board of Governors/S&P/Coresight Research[/caption]
The Job Market
The job market continued to pick up pace, accelerating from a strong January. In February, the US added 678,000 employees to nonfarm payrolls. Nonfarm employment is down 2.1 million, or 1.4% from its pre-pandemic level in February 2020, according to the BLS. In February, job gains were led by the construction, healthcare, leisure and hospitality, professional and business services, and transportation and warehousing sectors. The retail sector posted another strong month, adding 37,000 jobs in nonfarm payrolls. Specifically, the largest gains were seen in building material and garden supply stores (12,000) and furniture and home furnishing stores (6,000). Retail trade employment is 104,000 workers above its pre-pandemic February 2020 level.
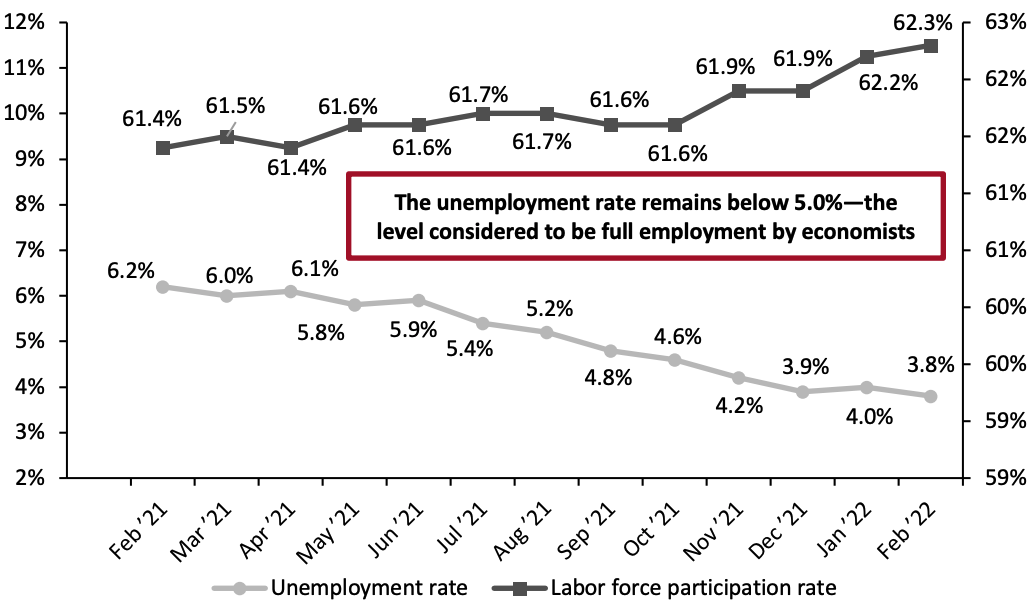
The unemployment rate ticked back down, falling from 4.0% in January to 3.8% in February. Hiring remained strong, owing to high demand for goods and services during the recovery from the pandemic. As of the end of January (latest available data) 11.3 million job openings remain, according the BLS. Meanwhile, the labor force participation rate saw another marginal increase in February, rising to 62.3%. Although the labor force participation rate increased, it remains 1.1 percentage points below its February 2020 pre-pandemic level.
Source: BEA/BLS/Federal Reserve Board of Governors/S&P/Coresight Research[/caption]
The Job Market
The job market continued to pick up pace, accelerating from a strong January. In February, the US added 678,000 employees to nonfarm payrolls. Nonfarm employment is down 2.1 million, or 1.4% from its pre-pandemic level in February 2020, according to the BLS. In February, job gains were led by the construction, healthcare, leisure and hospitality, professional and business services, and transportation and warehousing sectors. The retail sector posted another strong month, adding 37,000 jobs in nonfarm payrolls. Specifically, the largest gains were seen in building material and garden supply stores (12,000) and furniture and home furnishing stores (6,000). Retail trade employment is 104,000 workers above its pre-pandemic February 2020 level.
The unemployment rate ticked back down, falling from 4.0% in January to 3.8% in February. Hiring remained strong, owing to high demand for goods and services during the recovery from the pandemic. As of the end of January (latest available data) 11.3 million job openings remain, according the BLS. Meanwhile, the labor force participation rate saw another marginal increase in February, rising to 62.3%. Although the labor force participation rate increased, it remains 1.1 percentage points below its February 2020 pre-pandemic level.
Figure 4. US Unemployment Rate (Left Axis, %) and Labor Force Participation Rate (Right Axis, %) [caption id="attachment_144330" align="aligncenter" width="700"]
 Source: BLS[/caption]
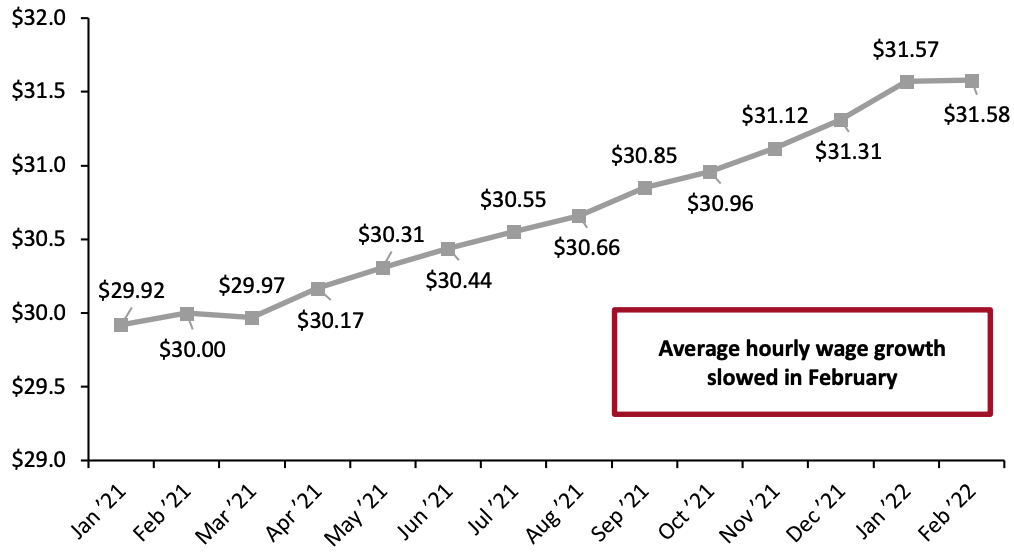
In a more positive sign for the inflationary outlook, the highs in average hourly wages slowed in February. Average hourly wages grew just $0.01 in February, rising to $31.58. Still, compared to a year ago, this marks a 5.1% increase in average hourly wages.
Source: BLS[/caption]
In a more positive sign for the inflationary outlook, the highs in average hourly wages slowed in February. Average hourly wages grew just $0.01 in February, rising to $31.58. Still, compared to a year ago, this marks a 5.1% increase in average hourly wages.
Figure 5. US Average Hourly Wages, All Private-Sector Employees (USD) [caption id="attachment_144331" align="aligncenter" width="700"]
 Source: BLS[/caption]
Implications
February marked the biggest monthly gain in job creation since July, picking up from a strong January. Another strong month of job creation brings employment closer to its pre-pandemic levels, as the labor market remains tight. However, Federal Reserve Chairman Jerome Powell has announced that the central bank is prepared to raise interest rates in half-percentage-point steps, high enough to deliberately slow the economy if such measures are deemed necessary to slow inflation. In the months ahead, hiring as well as average hourly wage growth may be challenged by elevated interest rates. Interest rate hikes affect the labor market indirectly. Should loans become more expensive or harder to come by, jobs and wages may feel the impact of reduced demand. For the moment, hiring and demand for workers remain strong. At the end of January (latest available data), there were 6.9 million job openings in the US.
Income, Savings and Sentiment
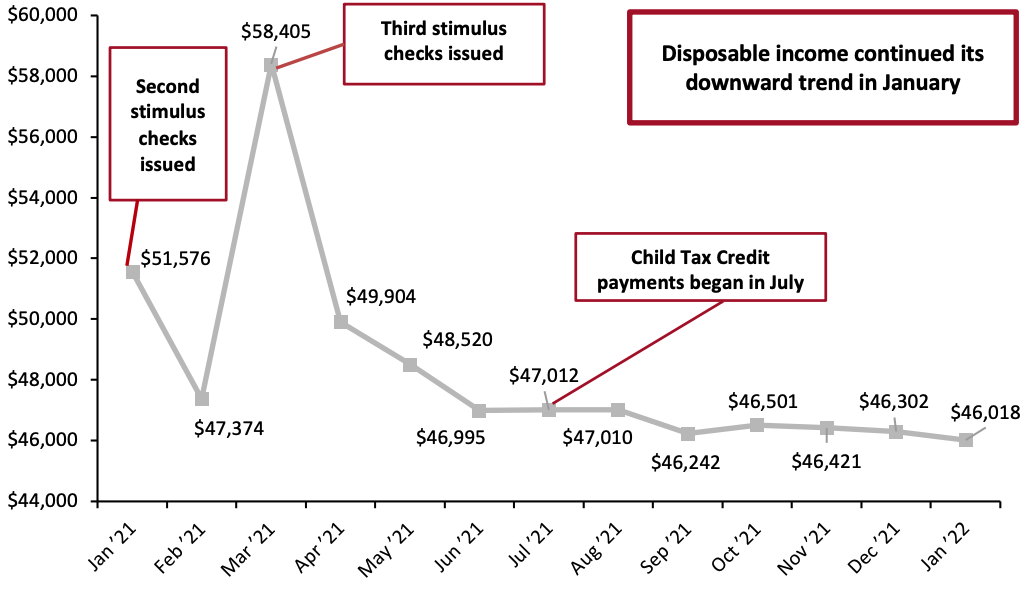
In January, real disposable income per capita continued to decline steadily. Real disposable income per capita has fallen substantially since the stimulus-driven spike in March. However, we estimate that consumers have accrued an additional $2.7 trillion in savings between the start of 2020 and September 2021, according to data from the US Bureau of Economic Analysis. These extra savings equate to further elevated spending, as seen in the first two months of retail sales data from the US Census Bureau. Consumers are continuing to spend strongly even within the current forty-year-high inflationary context.
Source: BLS[/caption]
Implications
February marked the biggest monthly gain in job creation since July, picking up from a strong January. Another strong month of job creation brings employment closer to its pre-pandemic levels, as the labor market remains tight. However, Federal Reserve Chairman Jerome Powell has announced that the central bank is prepared to raise interest rates in half-percentage-point steps, high enough to deliberately slow the economy if such measures are deemed necessary to slow inflation. In the months ahead, hiring as well as average hourly wage growth may be challenged by elevated interest rates. Interest rate hikes affect the labor market indirectly. Should loans become more expensive or harder to come by, jobs and wages may feel the impact of reduced demand. For the moment, hiring and demand for workers remain strong. At the end of January (latest available data), there were 6.9 million job openings in the US.
Income, Savings and Sentiment
In January, real disposable income per capita continued to decline steadily. Real disposable income per capita has fallen substantially since the stimulus-driven spike in March. However, we estimate that consumers have accrued an additional $2.7 trillion in savings between the start of 2020 and September 2021, according to data from the US Bureau of Economic Analysis. These extra savings equate to further elevated spending, as seen in the first two months of retail sales data from the US Census Bureau. Consumers are continuing to spend strongly even within the current forty-year-high inflationary context.
Figure 6. US Annualized Real Disposable Income Per Capita (USD) [caption id="attachment_144332" align="aligncenter" width="700"]
 Source: BEA[/caption]
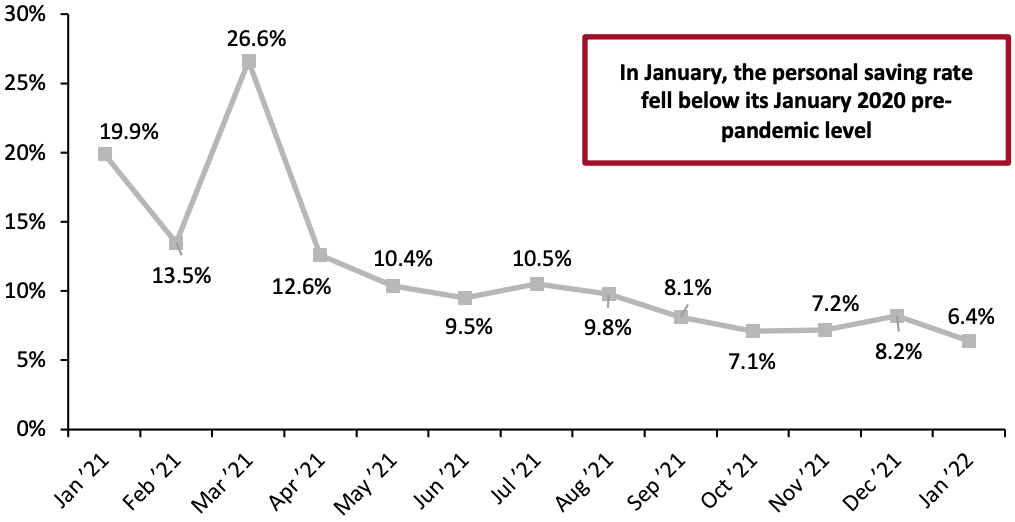
The personal saving rate fell by 1.8 PPTs in January to below its pre-pandemic January 2020 level. The drop in the saving rate is likely the result of consumers being forced to spend more within the current inflationary context. Despite the decline in the current personal saving rate, consumers appear to be well-equipped to maintain this level of spending, due to their pandemic-driven savings previously mentioned.
Source: BEA[/caption]
The personal saving rate fell by 1.8 PPTs in January to below its pre-pandemic January 2020 level. The drop in the saving rate is likely the result of consumers being forced to spend more within the current inflationary context. Despite the decline in the current personal saving rate, consumers appear to be well-equipped to maintain this level of spending, due to their pandemic-driven savings previously mentioned.
Figure 7. Personal Saving Rate (%) [caption id="attachment_144333" align="aligncenter" width="700"]
 Source: BEA[/caption]
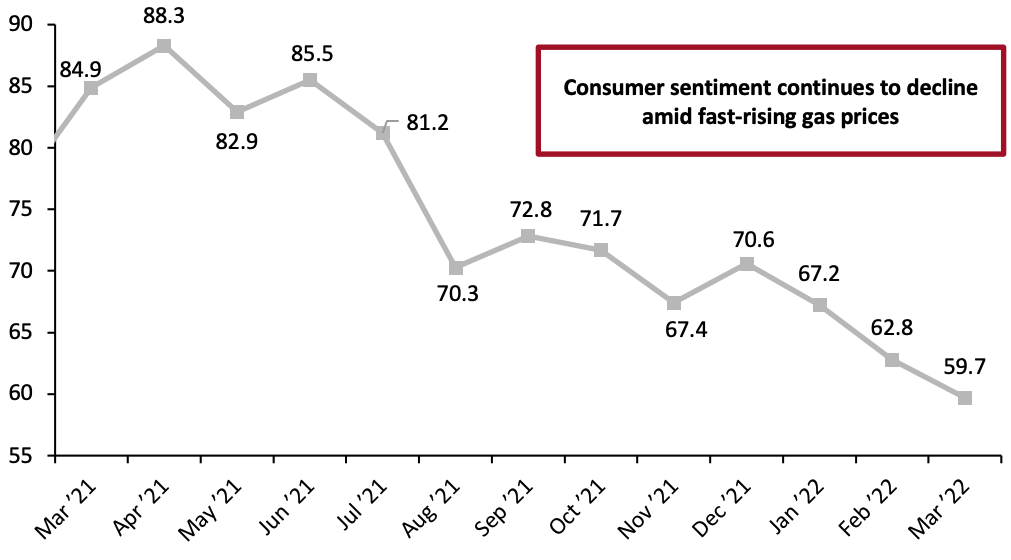
Consumer sentiment has fallen substantially since its slight improvement in December. Ongoing geopolitical developments, surging gas prices and an overall high-inflation environment are contributing to the lowest consumer sentiment rate in 11 years.
Source: BEA[/caption]
Consumer sentiment has fallen substantially since its slight improvement in December. Ongoing geopolitical developments, surging gas prices and an overall high-inflation environment are contributing to the lowest consumer sentiment rate in 11 years.
Figure 8. University of Michigan Consumer Sentiment Index [caption id="attachment_144334" align="aligncenter" width="700"]
 Source: University of Michigan[/caption]
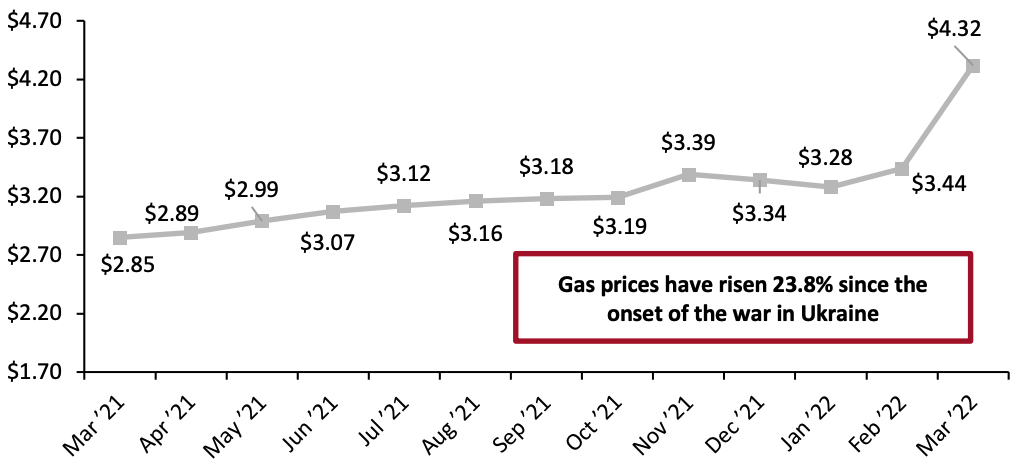
Gas prices have become increasingly volatile since Russia’s invasion of Ukraine. Gas prices were already high immediately before war broke out, at $3.49 per gallon on February 20, according to the Federal Reserve Bank of St. Louis. Since then, gas prices have risen to $4.32 per gallon, marking a 23.8% increase over the course of the past month. On March 7, gas prices surpassed $4.00 per gallon in the US for the first time since July 2008.
Source: University of Michigan[/caption]
Gas prices have become increasingly volatile since Russia’s invasion of Ukraine. Gas prices were already high immediately before war broke out, at $3.49 per gallon on February 20, according to the Federal Reserve Bank of St. Louis. Since then, gas prices have risen to $4.32 per gallon, marking a 23.8% increase over the course of the past month. On March 7, gas prices surpassed $4.00 per gallon in the US for the first time since July 2008.
Figure 9. US Regular All Formulations Gas Price (Dollars per Gallon) [caption id="attachment_144335" align="aligncenter" width="700"]
 Source: US Energy Information Administration[/caption]
Implications
Higher gasoline prices have a multiplier effect throughout the entire economy, impacting the price of goods delivery as well as personal travel. With gas prices at their highest level in over a decade, and inflation remaining high in aggregate, consumers’ spending power is diminished.
Housing
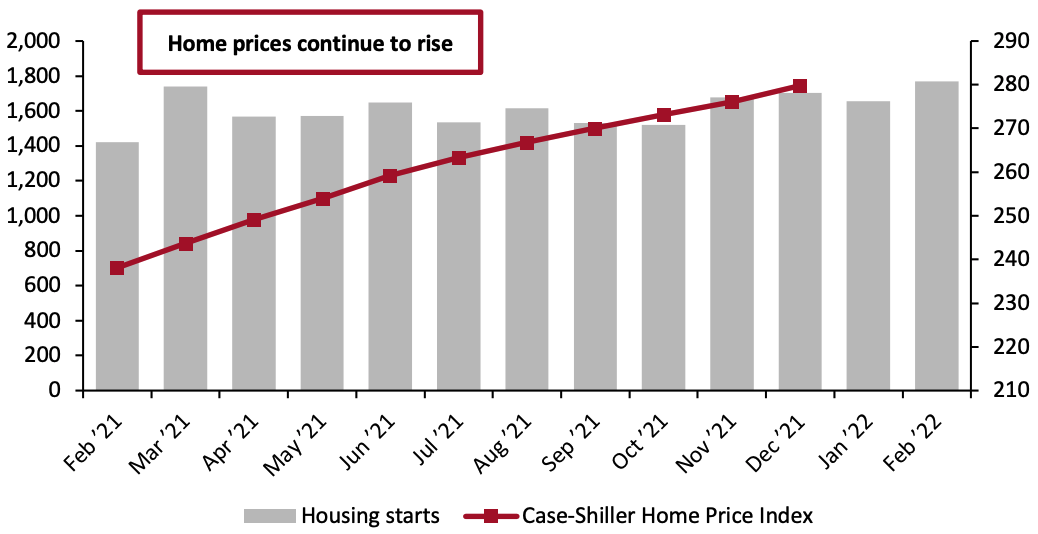
Housing starts picked up in February after slowing down slightly in January, increasing by 6.8% month over month. There were 1.8 million new housing starts in February.
Home prices continued to climb in December (the latest month for which Case-Shiller Index data is available), reaching 279.8 points, up from 276.1 points in November. Rising home prices can create a wealth effect, making consumers feel more affluent and emboldening them to spend. However, more recently, on March 16, the Federal Reserve Bank raised interest rates for the first time since 2008, by one-quarter of a percentage point. As a result, mortgage rates have risen above 4.0% for the first time since 2019, according to Freddie Mac, cutting into the wealth effect consumers were feeling.
Source: US Energy Information Administration[/caption]
Implications
Higher gasoline prices have a multiplier effect throughout the entire economy, impacting the price of goods delivery as well as personal travel. With gas prices at their highest level in over a decade, and inflation remaining high in aggregate, consumers’ spending power is diminished.
Housing
Housing starts picked up in February after slowing down slightly in January, increasing by 6.8% month over month. There were 1.8 million new housing starts in February.
Home prices continued to climb in December (the latest month for which Case-Shiller Index data is available), reaching 279.8 points, up from 276.1 points in November. Rising home prices can create a wealth effect, making consumers feel more affluent and emboldening them to spend. However, more recently, on March 16, the Federal Reserve Bank raised interest rates for the first time since 2008, by one-quarter of a percentage point. As a result, mortgage rates have risen above 4.0% for the first time since 2019, according to Freddie Mac, cutting into the wealth effect consumers were feeling.
Figure 10. Housing Starts (Thousands, Left Axis) and Case-Shiller US Home Price Index (Right Axis) [caption id="" align="aligncenter" width="700"]
 Source: HUD/US Census Bureau[/caption]
While the rise in housing prices causes some consumers to feel more affluent, it also means many are forced to rent rather than buy—contributing to rising rental prices. In February, consumer prices for rent of primary residences increased 4.2% from a year earlier, according to the BLS—its fastest pace since July 2007.
Implications
The strength of the housing market, and especially house prices, had been a large benefit for retail. House-moves contribute to furniture, furnishings, home-improvement and appliance sales and can trickle down further to discretionary sectors such as electronics. In February, the building material and garden supply sector saw sales rise by 14.9% from a year earlier. However, as the Fed has raised interest rates once more, we should expect to see a slowdown in home purchases and as a result, an eventual slowdown in the aforementioned retail sales sectors.
Source: HUD/US Census Bureau[/caption]
While the rise in housing prices causes some consumers to feel more affluent, it also means many are forced to rent rather than buy—contributing to rising rental prices. In February, consumer prices for rent of primary residences increased 4.2% from a year earlier, according to the BLS—its fastest pace since July 2007.
Implications
The strength of the housing market, and especially house prices, had been a large benefit for retail. House-moves contribute to furniture, furnishings, home-improvement and appliance sales and can trickle down further to discretionary sectors such as electronics. In February, the building material and garden supply sector saw sales rise by 14.9% from a year earlier. However, as the Fed has raised interest rates once more, we should expect to see a slowdown in home purchases and as a result, an eventual slowdown in the aforementioned retail sales sectors.
What We Think
Retail sales are off to a very strong start through the first two months of 2022, but we expect to see more modest growth in the remainder of the year. In year-over-year terms, retail sales growth numbers may seem comparatively lower than in prior months, since these numbers will be compared against a stimulus-driven historic jump in sales growth at this time last year. Implications for Brands/Retailers- The beginning of the interest rate hike is unlikely to significantly slow consumer spending in the near future and we should expect sales to be healthy (in absolute terms) in March and April. In year-over-year terms, the sales numbers may not look strong, but we must be mindful of their 2021 comparatives: the unusual stimulus-driven spike in sales at this time last year.
- As we move deeper into 2022, we should expect more modest sales growth in the mid-single digits as a further return to normalcy will direct an increased proportion of discretionary spending toward services and experiences rather than goods.
- The Federal Reserve’s interest rate hike will dampen the wealth effect consumers had been feeling, potentially resulting in a slight pullback in overall spending. However, consumers remain well-equipped to continue spending as a result of their pandemic-driven savings.