DIpil Das
The Coresight Research US Retail Traffic and In-Store Metrics series reviews year-over-year changes in selected store-based metrics, as reported by RetailNext. In this month’s report, we review store traffic changes through March 2021—a month that was positively impacted by the Covid-19 vaccine rollout and the issuance of stimulus checks, even as new Covid-19 cases increased during the final two weeks.
RetailNext’s coverage does not include food retailers but does include some other retail sectors deemed essential; the exclusion of food retail means that the figures cited below almost certainly overstate recent declines in total retail traffic.
Figure 1. US Store-Based Nonfood Retail Metrics: YoY % Change [caption id="attachment_126163" align="aligncenter" width="725"]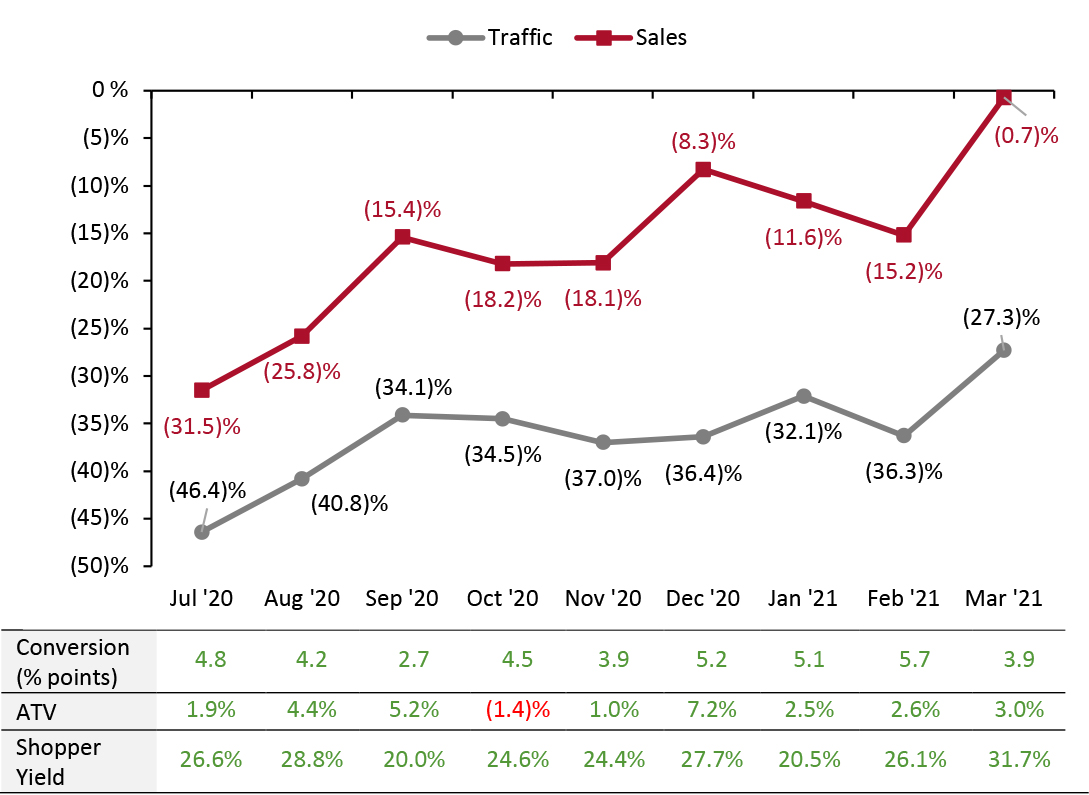 ATV=average transaction value; Shopper yield= Sales divided by traffic
Source: RetailNext [/caption] Weekly Shopper Traffic Trends Weekly data for March tracks the progress of store traffic over five weeks (February 28, 2021–April 3, 2021):
Figure 2. US Retail Traffic by Industry Vertical: YoY % Change [caption id="attachment_126164" align="aligncenter" width="725"]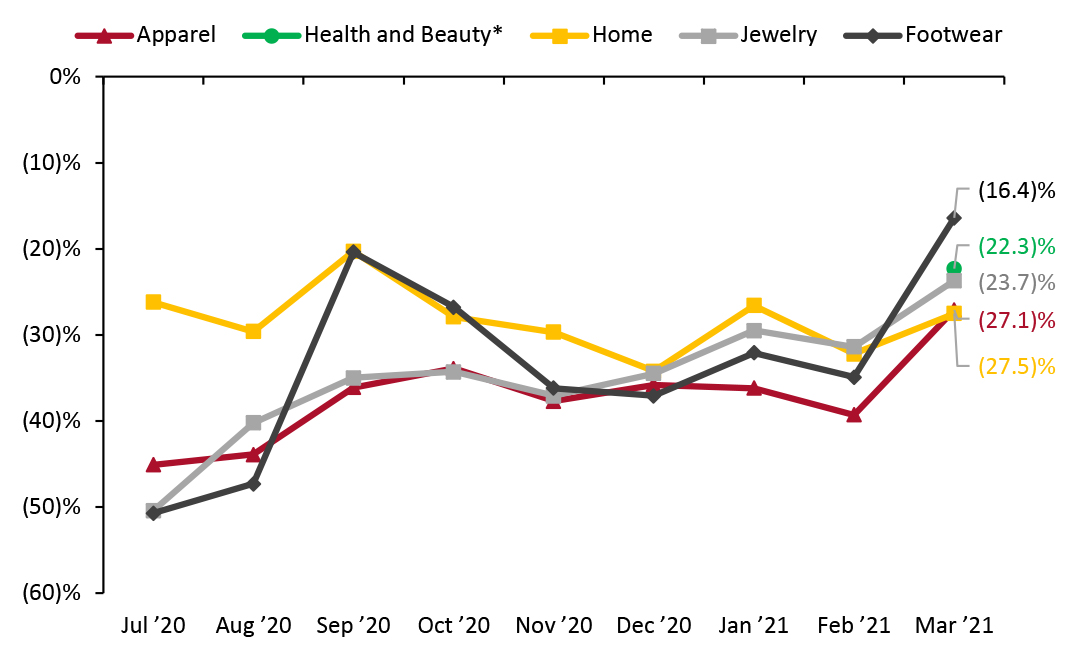 *RetailNext started providing traffic trends for the health and beauty sector from March 2021
Source: RetailNext [/caption] Regional Traffic Trends In March, new Covid-19 cases increased during weeks four and five, owing to the combination of states easing restrictions, Spring Break and the spread of the more contagious and deadlier B.1.1.7 variant strain. Many states, such as California and Florida, have accelerated timelines for vaccination eligibility to all individuals of at least 16 years of age, starting on April 15, 2021. Retail traffic in March varied across regions:
- March saw a substantial strengthening in traffic trends: Traffic declined by 27.3% year over year in March versus February’s 36.3% decline. The positive trend in this and other metrics aligns with the strong retail sales growth we saw in March, when total sales were up 17.3% year over year.
- The conversion rate (sales transactions as a percentage of traffic) grew by 3.9 percentage points in March, versus February’s growth of 5.7 percentage points.
- In March, ATV (sales divided by transactions) increased by 3.0%, up from February’s 2.6% growth.
- Shopper yield (sales divided by traffic) increased by 31.7% in March,up from February’s 26.1% growth.
Figure 1. US Store-Based Nonfood Retail Metrics: YoY % Change [caption id="attachment_126163" align="aligncenter" width="725"]
ATV=average transaction value; Shopper yield= Sales divided by traffic Source: RetailNext [/caption] Weekly Shopper Traffic Trends Weekly data for March tracks the progress of store traffic over five weeks (February 28, 2021–April 3, 2021):
- Traffic declined by 35.2% in the first week of March, a deterioration from the final week of February, which saw a traffic decline of 34.0%. Traffic declines further accelerated to 37.5% in the second week of March.
- However, declines eased substantially in the third week, reaching 23.3%. Traffic declines slightly accelerated to 26.4% in the fourth week.
- The fifth week saw the best performance, with declines easing substantially to 17.4%, even as the number of Covid-19 cases increased during the final two weeks of the month.
- The home sector experienced the greatest traffic decline, at 39.3%, an improvement of 470 basis points compared to February.
- The apparel sector saw a 27.1% decrease in traffic, an increase of 1,220 basis points compared to February.
- The footwear sector posted the lowest traffic decrease at 16.4%, an improvement of 1,850 basis points compared to February.
- The health and beauty sector was the second best-performing category, with a traffic decline of 22.3% in March. RetailNext started providing traffic trends for the health and beauty sector from March 2021.
- The jewelry sector posted a traffic decrease of 23.7%, an improvement of 770 basis points compared to February.
Figure 2. US Retail Traffic by Industry Vertical: YoY % Change [caption id="attachment_126164" align="aligncenter" width="725"]
*RetailNext started providing traffic trends for the health and beauty sector from March 2021 Source: RetailNext [/caption] Regional Traffic Trends In March, new Covid-19 cases increased during weeks four and five, owing to the combination of states easing restrictions, Spring Break and the spread of the more contagious and deadlier B.1.1.7 variant strain. Many states, such as California and Florida, have accelerated timelines for vaccination eligibility to all individuals of at least 16 years of age, starting on April 15, 2021. Retail traffic in March varied across regions:
- The Northeast was the worst-performing region, witnessing a traffic decline of 28.3%. The region saw its worst traffic trends in the second week of the month, with a decline of 37.8%, followed by the 36.7% decline of week one. However, the traffic trends improved in the third and fourth weeks. The region saw its best traffic trends in the fifth week of the month, with a decline of 19.0%.
- The Midwest posted the best traffic performance for the month, with a 23.6% decline. This region also witnessed its best traffic trends in the fifth week of March, with traffic improving to (15.2)% from (28.6)% in the previous week.
- The South posted a 24.5% traffic decline for the month. From week three onward, this region outperformed all other regions.
- The West posted an overall traffic decline of 28.0%. The region witnessed its largest traffic declines in the second week of March. Similar to other regions, traffic trends were best in week five.
- Traffic by mall location type declined between 14% and 35%—strip malls outperformed all other location types by 13 percentage points, with a decline of only 14.6%. These locations benefited from being open-air and from the presence of nondiscretionary retailers, such as food retailers.
- Street-front/freestanding and luxury locations witnessed the largest traffic declines of around 35%, while traditional mall locations and outlet locations saw traffic declines of around 28%.
- Other retail locations, including airports, casinos and hotels, reported a traffic decline of more than 30%. Many of these locations are situated in destination areas and were impacted by lower foot traffic in tourist areas owing to travel restrictions, as well as consumers avoiding such areas amid the pandemic.