
DIpil Das
US Retail Sales: March 2021
Coresight Research’s measure of core retail sales is the unadjusted year-over-year change, excluding gasoline and automobiles. This metric accelerated to 17.3% in March, as reported by the US Census Bureau on April 15, 2021. March’s year-over-year growth was the strongest we have seen since the beginning of the Covid-19 pandemic, as shown in Figure 1 below.Figure 1. US Total Retail Sales ex. Gasoline and Automobiles: YoY % Change [caption id="attachment_125952" align="aligncenter" width="720"]
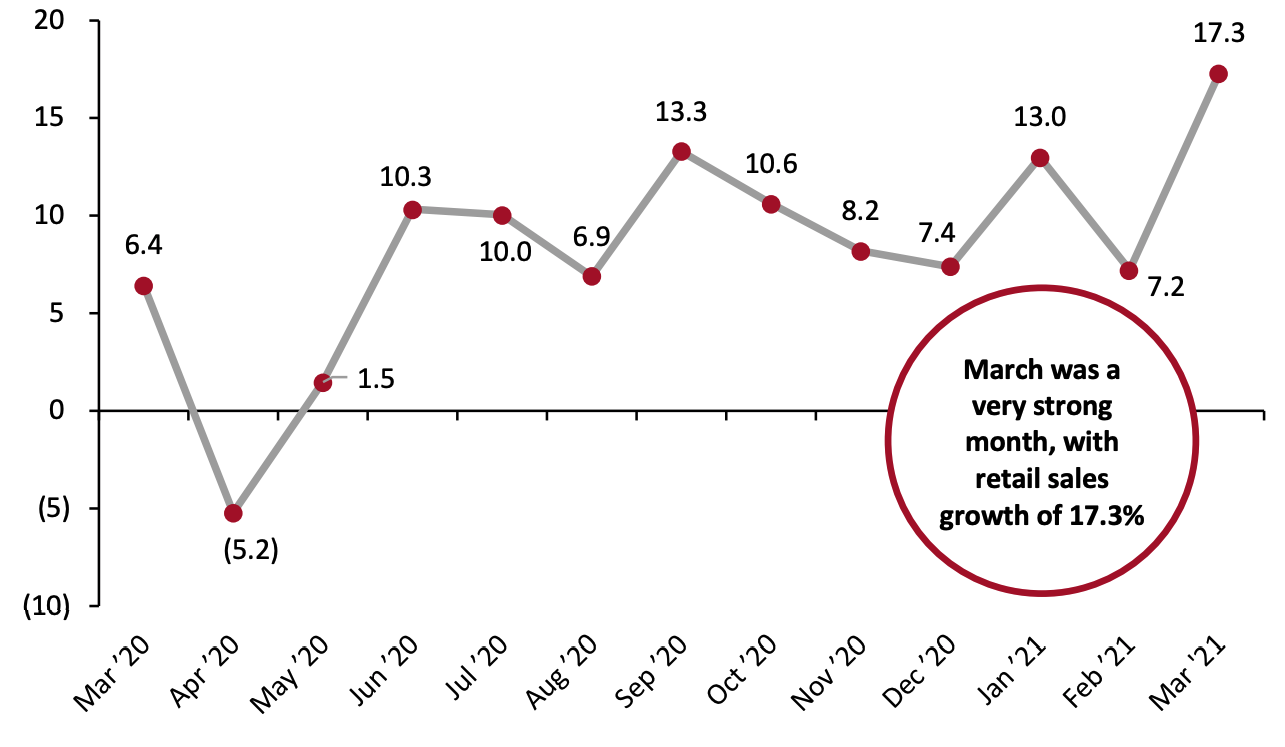 Data are not seasonally adjusted
 Source: US Census Bureau/Coresight Research [/caption] The strong year-over-year growth was partly due to weak comparables, with March 2020 having recorded soft growth as the Covid-19 pandemic hit the US. However, comparing sales to March 2019 paints a similarly positive picture of strong growth in March 2021, with a two-year increase of 24.9%—up from the 15.5% two-year increase in February.
Figure 2. US Total Retail Sales ex. Gasoline and Automobiles: % Change from Two Years Prior [caption id="attachment_125937" align="aligncenter" width="725"]
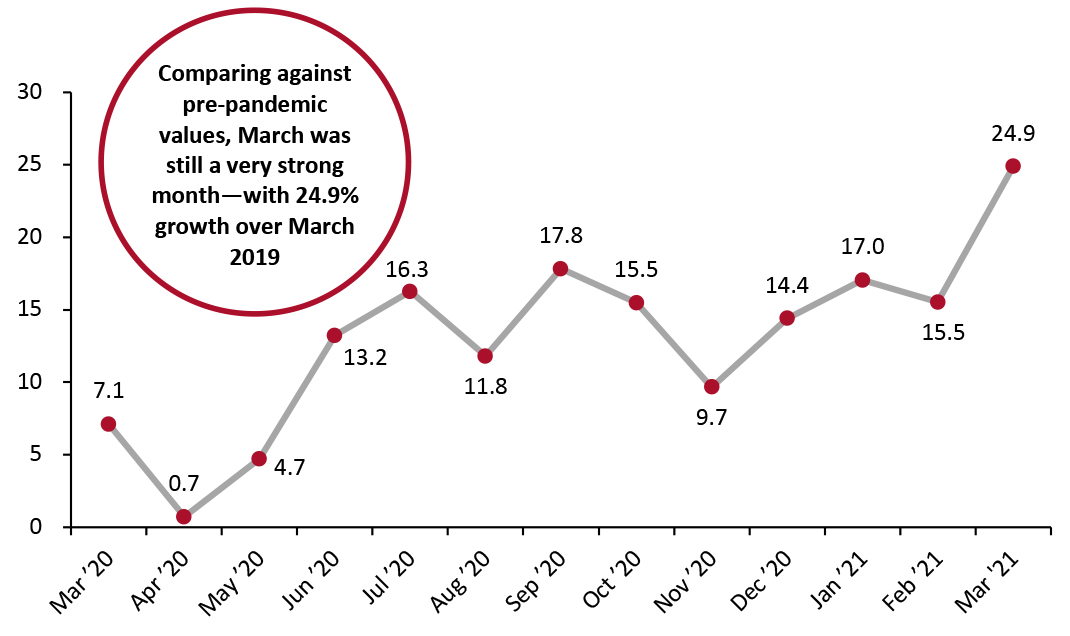 Source: US Census Bureau/Coresight Research[/caption]
Seasonally adjusting retail sales data and including automobiles and gasoline, March saw by far the strongest year-over-year growth of recent times, at 26.9%. Some of this growth is due to annualizing the Covid-19 outbreak in the US, but it is worth noting that March 2020 sales declined by only 2.6% year over year—meaning that the March 2021 growth cannot be entirely attributed to this reason.
Source: US Census Bureau/Coresight Research[/caption]
Seasonally adjusting retail sales data and including automobiles and gasoline, March saw by far the strongest year-over-year growth of recent times, at 26.9%. Some of this growth is due to annualizing the Covid-19 outbreak in the US, but it is worth noting that March 2020 sales declined by only 2.6% year over year—meaning that the March 2021 growth cannot be entirely attributed to this reason.
Figure 3. US Total Retail Sales incl. Gasoline and Automobiles: YoY % Change [caption id="attachment_125938" align="aligncenter" width="725"]
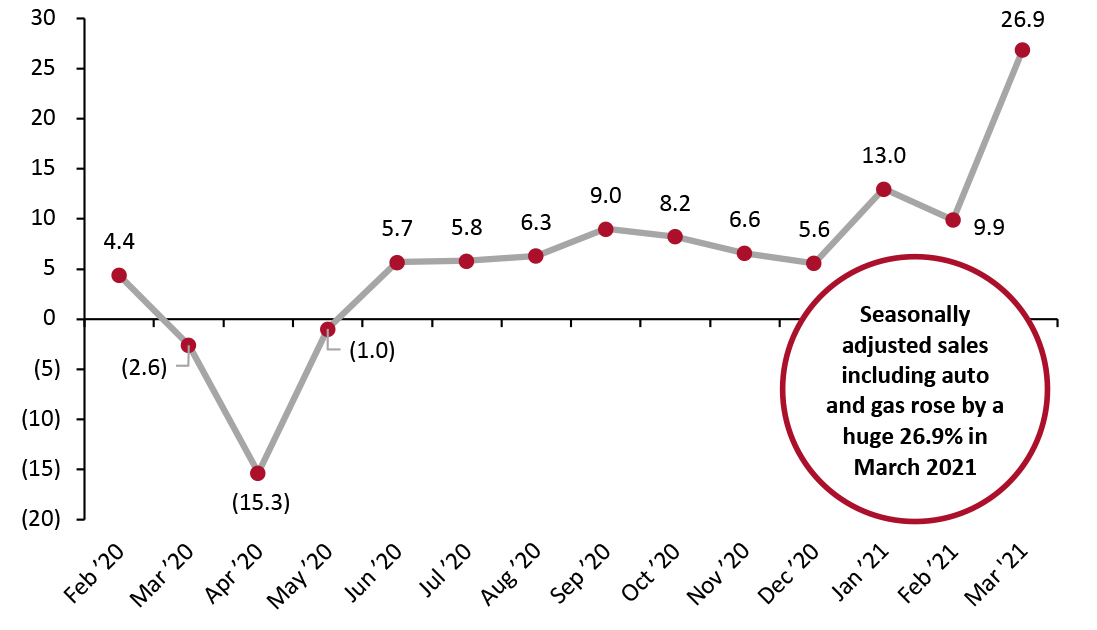 Data are seasonally adjusted
 Source: US Census Bureau/Coresight Research [/caption] Stimulus Drives Month-over-Month Spike in Retail Sales In terms of month-over-month growth in seasonally adjusted retail sales (excluding gasoline and automobiles), March closely mirrored January’s performance: Both months were boosted by the issuance of stimulus checks by the federal government. March’s growth of 7.2% was slightly lower than January’s 8.4% growth but still represented a strong increase following a disappointing February. In April, which will feature no direct stimulus checks from the government, we expect to see a month-over-month decline in sales. This will likely be more moderate than February’s relatively steep drop-off of 3.4% that was compounded by a winter storm that tamped down spending.
Figure 4. US Total Retail Sales ex. Gasoline and Automobiles: MoM % Change [caption id="attachment_125939" align="aligncenter" width="725"]
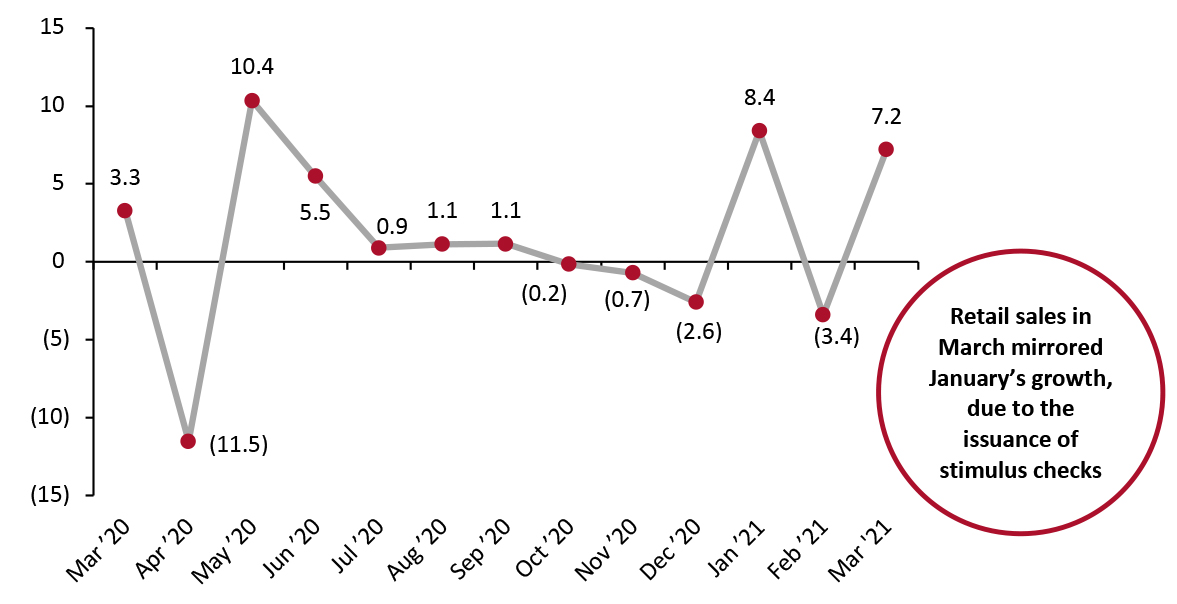 Data are seasonally adjusted
 Source: US Census Bureau/Coresight Research [/caption] Retail Sales Growth by Sector The Covid-19 outbreak in March 2020 caused certain sectors to see sales decline dramatically, skewing sector-by-sector one-year growth numbers. To avoid these complications, we largely compare March 2021 to pre-pandemic March 2019 sales in this section. Many sectors saw exceptionally strong growth in March:
- Nonstore retailers saw strong growth in March whether compared to 2019 or 2020: Sales were up 30.7% from 2020 and 52.0% from 2019. In February, sales rose by only 37.7% from 2019 values.
- As they have done throughout the pandemic, home-improvement retailers also performed well. Sales were up 64.0% from 2019, far higher than the 22.7% two-year growth from February.
- Sporting goods and hobby store sales grew 46.6% in March from their 2019 levels—substantially higher than their already strong 19.6% growth in February. Many consumers appear to be spending parts of their stimulus checks on stores in this sector, as these stores saw a similar jump in sales growth in January when the previous round of stimulus was issued.
- Miscellaneous store retailers saw 30.7% growth from their 2019 values, up from 15.2% growth in February.
- Furniture and home-furnishing stores saw 19.8% growth from 2019, continuing the sector’s strong rebound in sales after struggling during much of the pandemic. The sector is likely growing as a delayed reaction to the strong housing market during the pandemic.
- Health and personal care stores saw sales climb 15.0% from 2019—far higher than February’s 4.8% growth—as consumers continue to focus on health and wellness.
- Food and beverage stores saw sales climb by 13.9% on a two-year basis but decline by 10.2% from 2020 as strong grocery comparables hampered year-over-year growth. The record grocery sales growth seen during 2020 will likely lead to slight declines in food and beverage sales from 2020 levels over the rest of 2021.
- After struggling in February, electronics and appliance store sales rose 5.7% from 2019 values in March, likely the result of consumers receiving stimulus checks, which they spent on major purchases at higher rates.
- Clothing and accessory store sales more than doubled versus March 2020. They were higher than their 2019 values for the first time since the beginning of the pandemic, rising 1.0% in March after dropping 12.0% below 2019 values in February. While this is a positive sign for the sector, growth may be fleeting as consumers are unlikely to receive further stimulus checks.
- While general merchandise stores as a whole were 14.0% higher than in March 2019, department stores saw sales decline by 2.8% from 2019—a stark improvement from February’s 16.4% decline but still a sign that the sector remains structurally challenged.
Figure 5. US Total Retail Sales, by Sector: YoY % Change from 2020 (Top) and 2019 (Bottom) [wpdatatable id=877 table_view=regular] [wpdatatable id=878 table_view=regular]
Data are not seasonally adjusted Source: US Census Bureau/Coresight Research