DIpil Das
What’s the Story?
In our Leading Indicators of US Retail Sales monthly series, we examine several key macroeconomic indicators of US retail sales and analyze how they may impact the industry in the months to come. We analyze the latest available data, as of the end of March 2021, from sources such as the US Census Bureau, the US Bureau of Economic Analysts (BEA), the US Bureau of Labor Statistics (BLS) and the US Department of Housing and Urban Development (HUD).Why It Matters
Macroeconomic indicators have a significant impact on overall retail sales growth. Looking at 10 indicators (unemployment rate, labor force participation rate, disposable income per capita, average hourly raises, consumer sentiment, savings rate, gas price, interest rate, housing starts and housing prices), we can historically account for a majority of the variation in retail sales growth and create a strong basis for predicting sales moving forward. The close correlation between retail sales growth predictions based on economic indicators and actual retail sales growth is shown in Figure 1.Figure 1. US Actual Retail Sales ex. Auto and Gas Sales vs. Model Predicted Sales, January 2000–January 2021 (YoY % Change) [caption id="attachment_125684" align="aligncenter" width="725"]
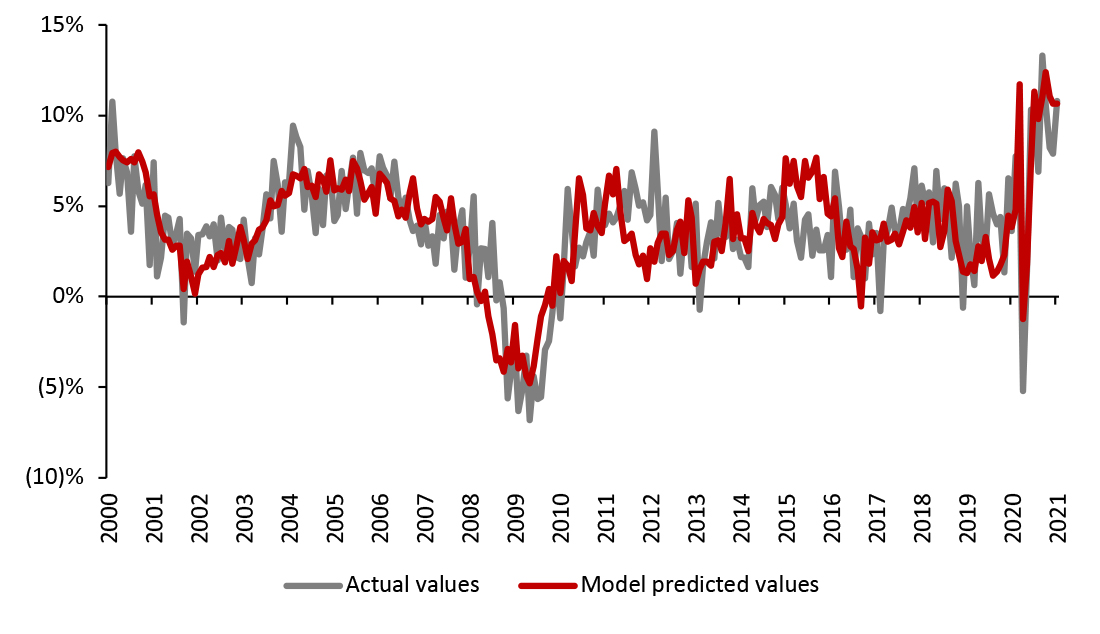 Source: BEA/BLS/Federal Reserve Board of Governors /S&P/Coresight Research[/caption]
After an exceptionally strong January, retail sales experienced lesser but still solid growth in February. The decline was likely due in large part to a lack of government stimulus that month, along with a major winter storm that kept many consumers at home for around a week of the already short month. Last month, we predicted retail sales would be weaker in March without the issuance of another round of stimulus. However, in March, the government issued one-time stimulus payments of up to $1,400 per individual, likely boosting retail sales in the month, pointing to a stronger March than otherwise would have been the case. We examine major macroeconomic indicators to outline what the coming months in sales will look like.
Source: BEA/BLS/Federal Reserve Board of Governors /S&P/Coresight Research[/caption]
After an exceptionally strong January, retail sales experienced lesser but still solid growth in February. The decline was likely due in large part to a lack of government stimulus that month, along with a major winter storm that kept many consumers at home for around a week of the already short month. Last month, we predicted retail sales would be weaker in March without the issuance of another round of stimulus. However, in March, the government issued one-time stimulus payments of up to $1,400 per individual, likely boosting retail sales in the month, pointing to a stronger March than otherwise would have been the case. We examine major macroeconomic indicators to outline what the coming months in sales will look like.
Leading Indicators of US Retail Sales: In Detail
Indicators Overview Of the 10 indicators we examined, four are likely to have a positive impact on retail sales in coming months. The second wave of labor market recovery appears to be under way in the US, while stimulus checks keep disposable income high and strong asset markets boost consumer confidence.Figure 2. US: Leading Indicators of Retail Sales, as of the End of March 2021 [caption id="attachment_125685" align="aligncenter" width="725"]
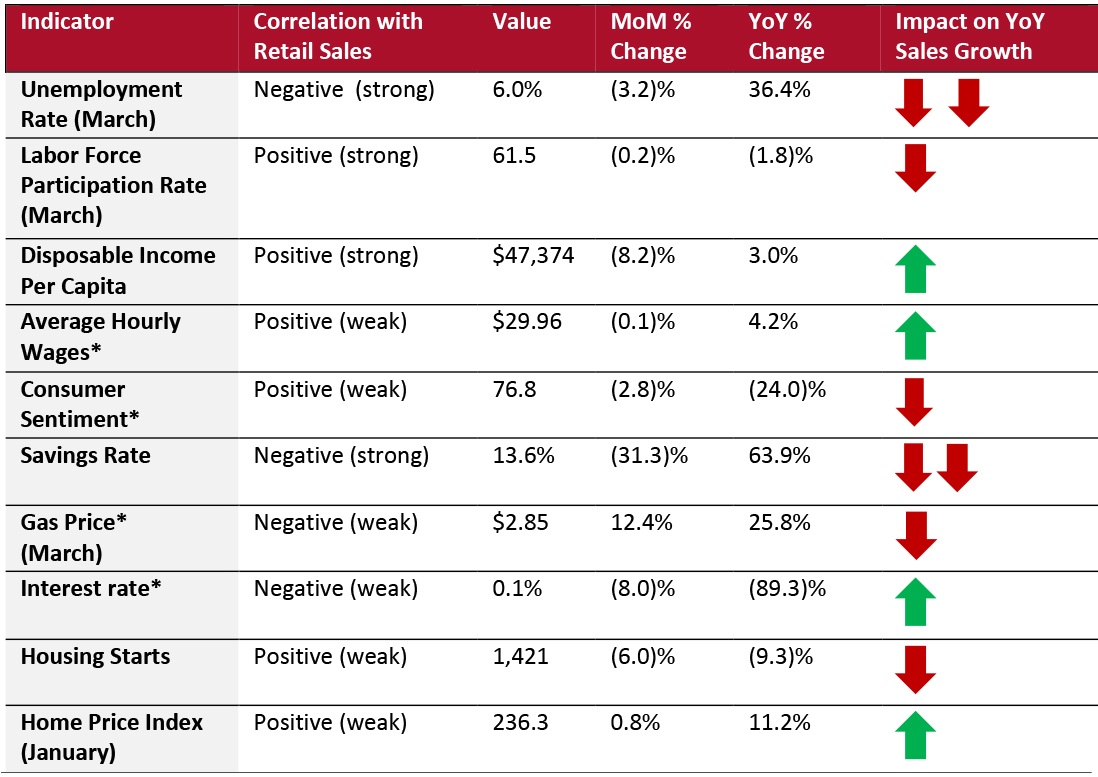 Latest available data from February unless otherwise indicated
 *Not included in predictive model
Source: BEA/BLS/Federal Reserve Board of Governors /S&P/University of Michigan/US Energy Information Administration/Coresight Research [/caption] Looking ahead to yet-to-be-reported March sales and projected sales in April, we predict that retail sales will increase by 16.9% year over year, as illustrated in Figure 3. This high growth estimate is partly due to the major dip in retail sales in the year-ago period at the outset of the pandemic in the US. Growth will be driven by the stimulus distributed in March 2021, a recovering job market and ongoing vaccination efforts that are inching the US back toward normalcy.
Figure 3. US Retail Sales ex. Auto and Gas (YoY % Change) [caption id="attachment_125686" align="aligncenter" width="725"]
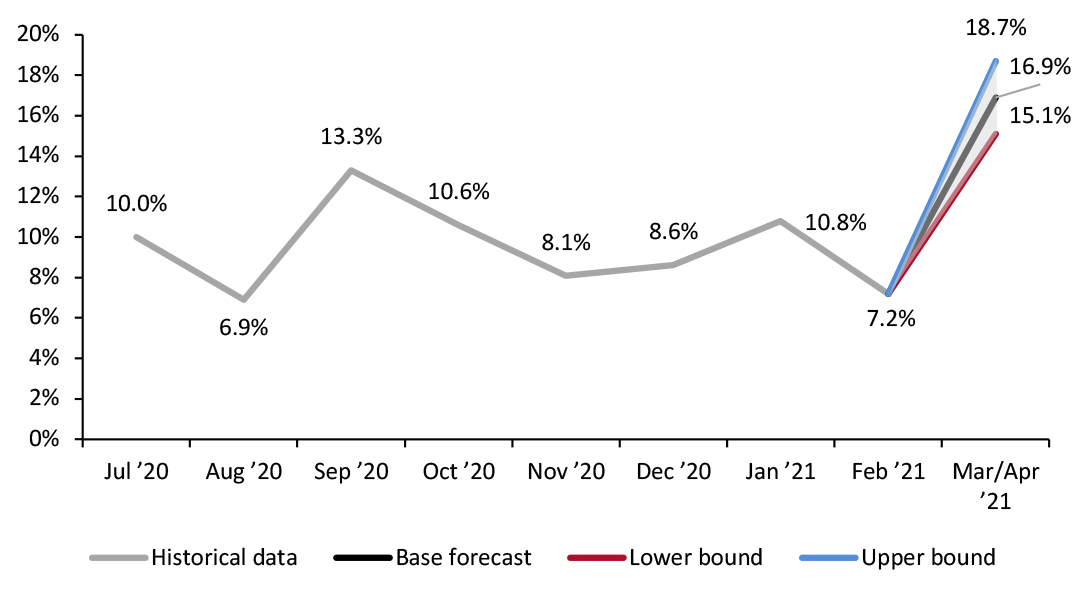 Note: BEA/BLS/Federal Reserve Board of Governors /S&P/Coresight Research[/caption]
The Job Market
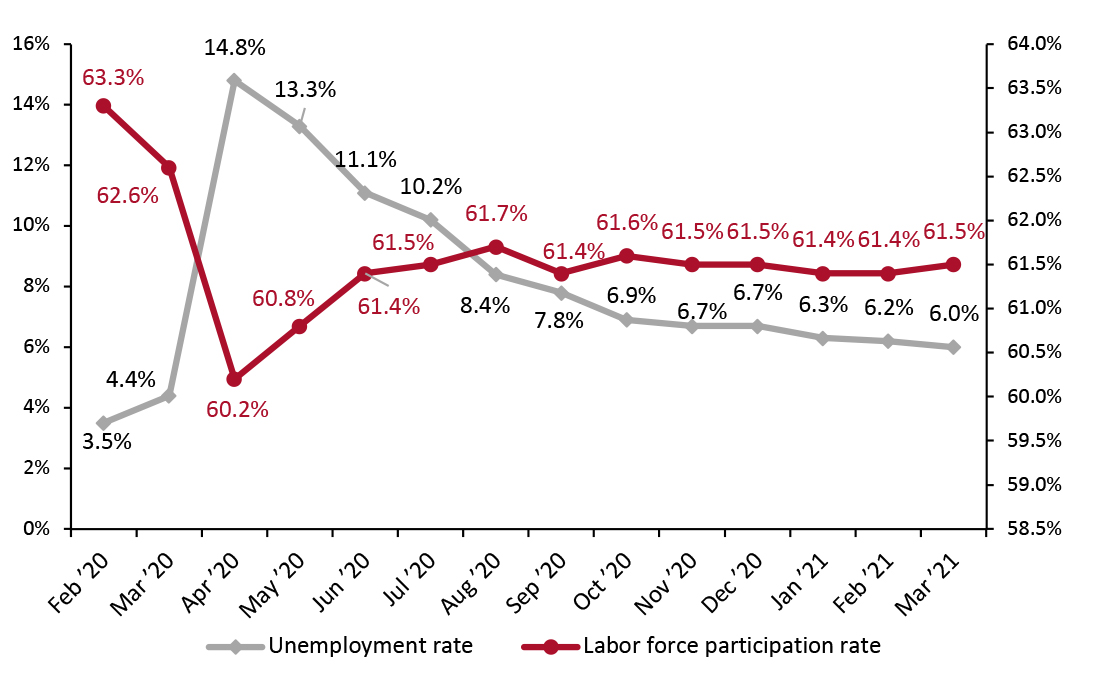
After stalling in late fall and early winter, the recovery of the job market appears to be back on track. The unemployment rate decreased to 6.0% in March 2021, still far above pre-pandemic levels but continuing to edge closer to normalcy.
The labor force participation rate rose for the first time since September 2020. In the previous Leading Indicators of US Retail Sales report, we predicted that a full recovery of the labor market would require speedy vaccinations and a sharp decrease in Covid-19 cases. While the number of cases nationwide has largely remained steady, vaccinations have taken off at a faster rate than previously thought. As of early April, 33% of the US population has received at least one dose of a Covid-19 vaccine. On April 3, the US set a new record by administering more than 4 million shots in one day.
As a result of the continued vaccine rollout, consumers are more willing to get out of the house and spend—including on services and experiences that they may have been avoiding previously. This diversification and increase in spending should continue to boost employment in service sectors (which have been hit hard by the pandemic) and drive people back into the labor force.
Note: BEA/BLS/Federal Reserve Board of Governors /S&P/Coresight Research[/caption]
The Job Market
After stalling in late fall and early winter, the recovery of the job market appears to be back on track. The unemployment rate decreased to 6.0% in March 2021, still far above pre-pandemic levels but continuing to edge closer to normalcy.
The labor force participation rate rose for the first time since September 2020. In the previous Leading Indicators of US Retail Sales report, we predicted that a full recovery of the labor market would require speedy vaccinations and a sharp decrease in Covid-19 cases. While the number of cases nationwide has largely remained steady, vaccinations have taken off at a faster rate than previously thought. As of early April, 33% of the US population has received at least one dose of a Covid-19 vaccine. On April 3, the US set a new record by administering more than 4 million shots in one day.
As a result of the continued vaccine rollout, consumers are more willing to get out of the house and spend—including on services and experiences that they may have been avoiding previously. This diversification and increase in spending should continue to boost employment in service sectors (which have been hit hard by the pandemic) and drive people back into the labor force.
Figure 4. US Unemployment Rate (Left Axis, %) and Labor Force Participation Rate (Right Axis, %) [caption id="attachment_125707" align="aligncenter" width="725"]
 Source: BLS[/caption]
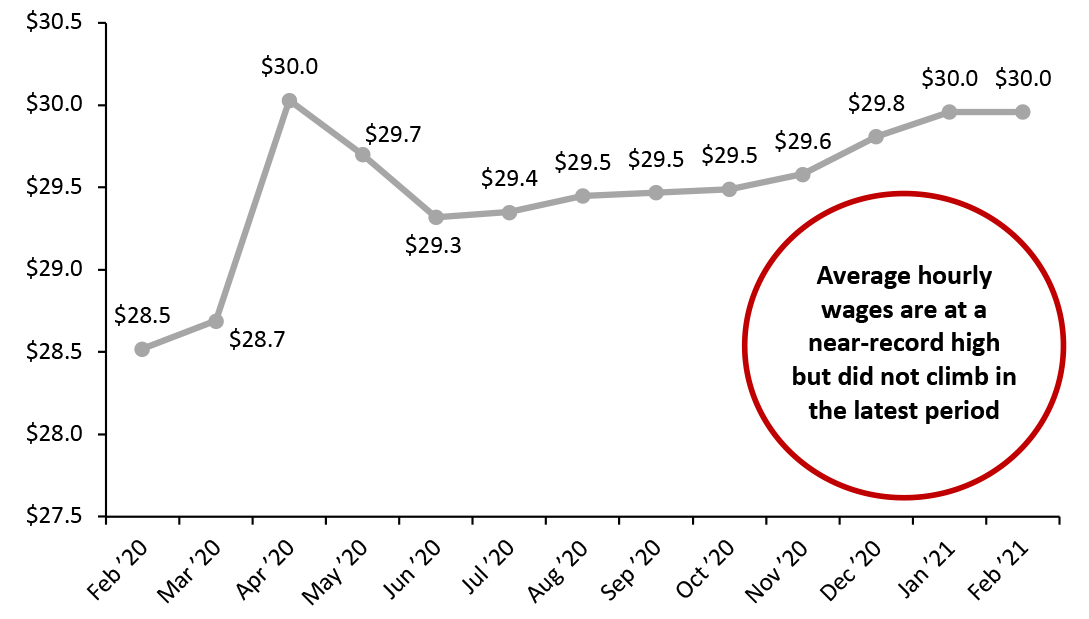
Average hourly wages across all private-sector employees stood at $29.96 as of February 2021, the first period since July 2020 in which wages did not climb month over month. However, hourly wages remain at a near-record high. The stall of growth is unlikely to be a sign that economic growth is slowing; instead, it is a positive indicator that lower-wage workers are finding their way back into the workforce as the economy continues to fully reopen.
Source: BLS[/caption]
Average hourly wages across all private-sector employees stood at $29.96 as of February 2021, the first period since July 2020 in which wages did not climb month over month. However, hourly wages remain at a near-record high. The stall of growth is unlikely to be a sign that economic growth is slowing; instead, it is a positive indicator that lower-wage workers are finding their way back into the workforce as the economy continues to fully reopen.
Figure 5. US Average Hourly Wages, All Private-Sector Employees (USD) [caption id="attachment_125708" align="aligncenter" width="725"]
 Source: BLS[/caption]
Implications
The unexpectedly fast rollout of vaccines in the US has accelerated the recovery of the labor market as consumers get back to spending more in line with pre-pandemic habits. As we continue to move toward herd immunity, the unemployment rate is likely to creep closer to pre-pandemic levels, with low-wage workers in service industries finally able to get back to work. Retailers can expect consumers who have been unemployed to re-enter the labor force and build up spending power. However, whether they spend that money on goods or services is a more complicated question, as consumers will have increased spending options as the US recovers from the pandemic.
Income, Savings and Sentiment
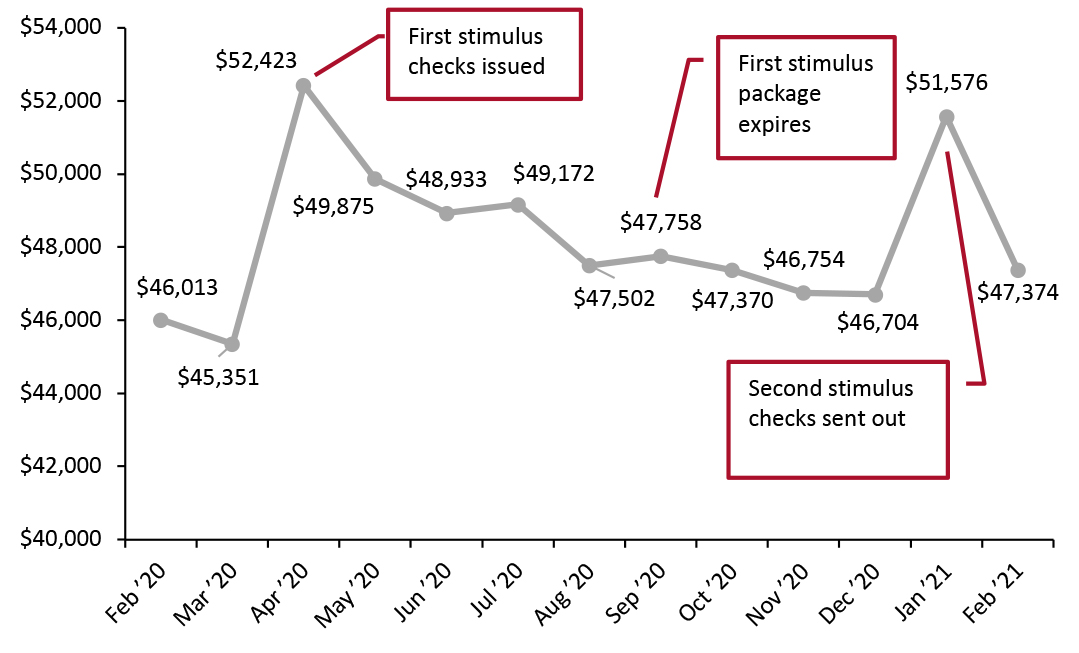
In February 2021, disposable income predictably fell after skyrocketing in January 2021 due to the issuance of stimulus checks. We expect March data to show a similar a spike in disposable income, reflecting the injection of further government-issued stimulus in the month; disposable income per capita is likely to reach around $52,000.
Source: BLS[/caption]
Implications
The unexpectedly fast rollout of vaccines in the US has accelerated the recovery of the labor market as consumers get back to spending more in line with pre-pandemic habits. As we continue to move toward herd immunity, the unemployment rate is likely to creep closer to pre-pandemic levels, with low-wage workers in service industries finally able to get back to work. Retailers can expect consumers who have been unemployed to re-enter the labor force and build up spending power. However, whether they spend that money on goods or services is a more complicated question, as consumers will have increased spending options as the US recovers from the pandemic.
Income, Savings and Sentiment
In February 2021, disposable income predictably fell after skyrocketing in January 2021 due to the issuance of stimulus checks. We expect March data to show a similar a spike in disposable income, reflecting the injection of further government-issued stimulus in the month; disposable income per capita is likely to reach around $52,000.
Figure 6. US Annualized Real Disposable Income Per Capita (USD) [caption id="attachment_125710" align="aligncenter" width="725"]
 Source: BEA[/caption]
Even beyond the stimulus-fueled growth in disposable income in January, the metric does appear to be on an upward path: In February 2021, a month with no direct stimulus payments to consumers, disposable income was 1.4% higher than in December 2020. As more people get back to work, we expect to continue to see strong figures in this metric moving forward.
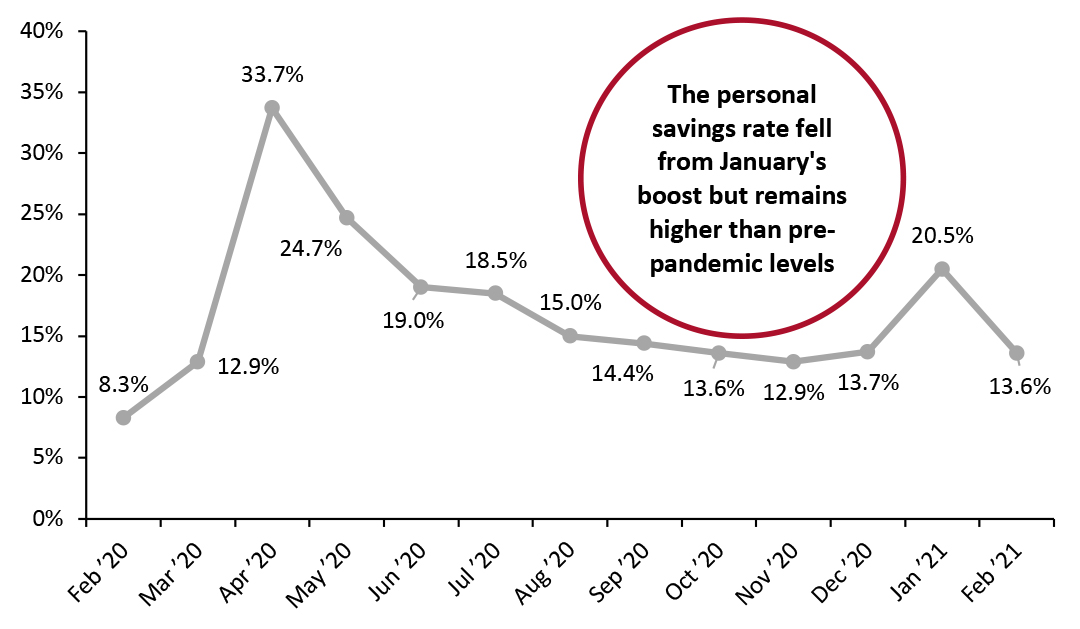
Like disposable income, the personal savings rate dropped in February after shooting up in January upon the issuance of stimulus checks. We expect March data to show a climb in the savings rate to about 20.0% as consumers save a substantial portion of their stimulus checks. Consumers are still saving at rates far higher than they were before the pandemic, but we expect that the savings rate will decline substantially in the medium term, due to the likely end of direct stimulus payments and increasing spending options.
Source: BEA[/caption]
Even beyond the stimulus-fueled growth in disposable income in January, the metric does appear to be on an upward path: In February 2021, a month with no direct stimulus payments to consumers, disposable income was 1.4% higher than in December 2020. As more people get back to work, we expect to continue to see strong figures in this metric moving forward.
Like disposable income, the personal savings rate dropped in February after shooting up in January upon the issuance of stimulus checks. We expect March data to show a climb in the savings rate to about 20.0% as consumers save a substantial portion of their stimulus checks. Consumers are still saving at rates far higher than they were before the pandemic, but we expect that the savings rate will decline substantially in the medium term, due to the likely end of direct stimulus payments and increasing spending options.
Figure 7. Personal Savings Rate (%) [caption id="attachment_125690" align="aligncenter" width="725"]
 Source: BEA[/caption]
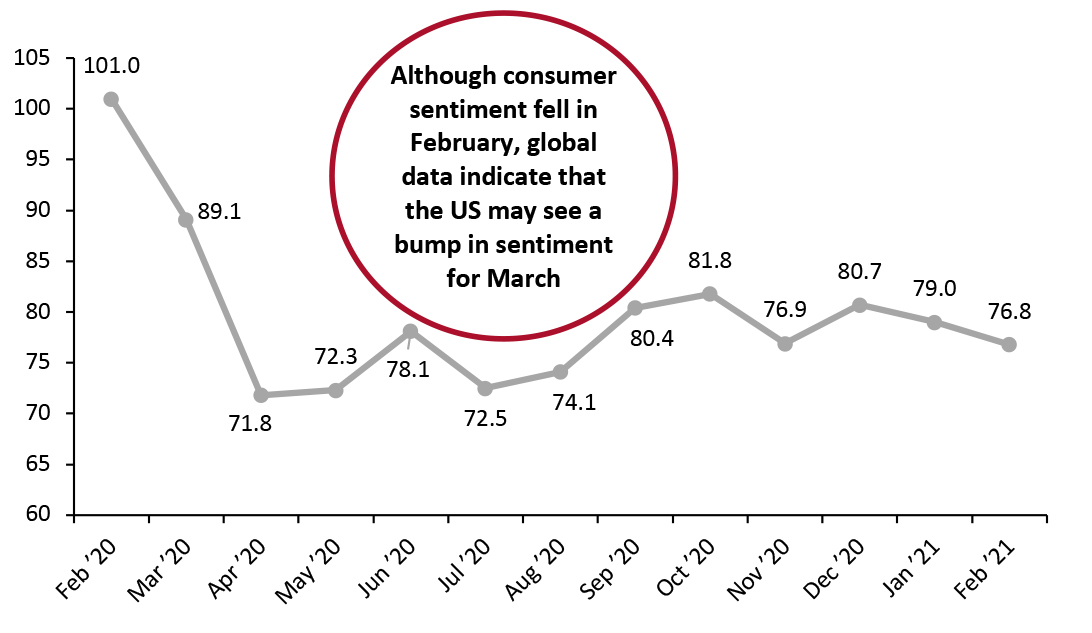
Somewhat surprisingly, consumer confidence fell in February, according to the University of Michigan Consumer Sentiment Index—representing the second consecutive month of a decline in this metric and hitting the lowest level since August 2020.
However, a more recent global measure of consumer confidence reported by The Conference Board indicates that consumer sentiment skyrocketed in March: The index rose to 109.7 in March, up from 90.7 in February. It will be interesting to see to what extent the US aligns with this trend when March data are released for the University of Michigan Consumer Sentiment Index.
Source: BEA[/caption]
Somewhat surprisingly, consumer confidence fell in February, according to the University of Michigan Consumer Sentiment Index—representing the second consecutive month of a decline in this metric and hitting the lowest level since August 2020.
However, a more recent global measure of consumer confidence reported by The Conference Board indicates that consumer sentiment skyrocketed in March: The index rose to 109.7 in March, up from 90.7 in February. It will be interesting to see to what extent the US aligns with this trend when March data are released for the University of Michigan Consumer Sentiment Index.
Figure 8. University of Michigan Consumer Sentiment Index [caption id="attachment_125702" align="aligncenter" width="725"]
 Source: University of Michigan[/caption]
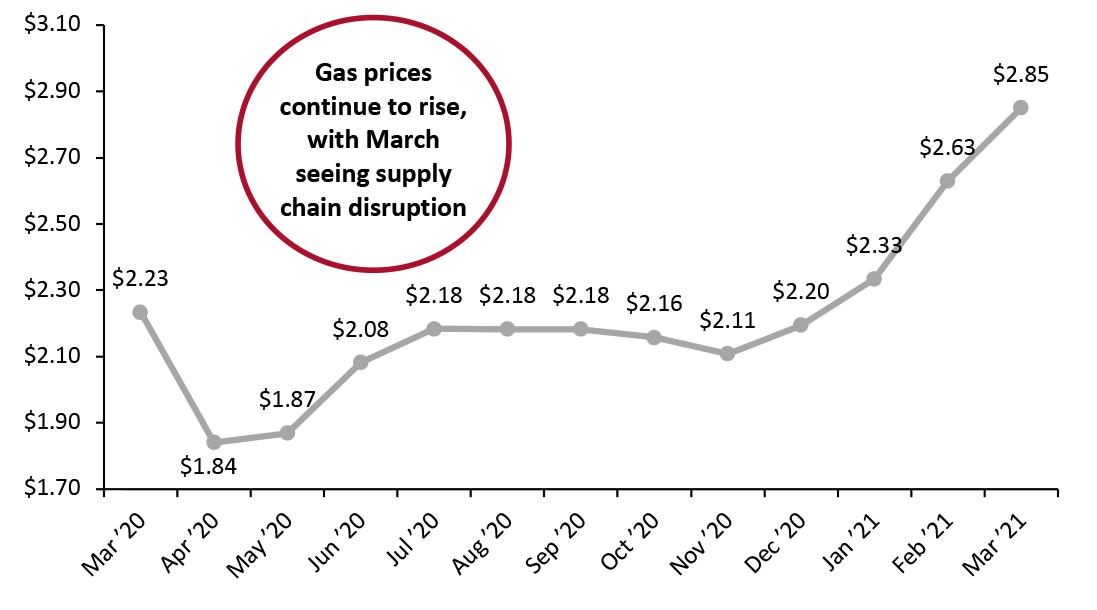
Gas prices have continued to rise, in part due to disruption to the global supply chain caused by the temporary blockage of the Suez Canal. As consumers get back to going out and about more, rising gas prices will be of increasing concern.
Source: University of Michigan[/caption]
Gas prices have continued to rise, in part due to disruption to the global supply chain caused by the temporary blockage of the Suez Canal. As consumers get back to going out and about more, rising gas prices will be of increasing concern.
Figure 9. US Regular All Formulations Gas Price (Dollars per Gallon) [caption id="attachment_125692" align="aligncenter" width="725"]
 Source: US Energy Information Administration[/caption]
Implications
The savings rate remains above pre-pandemic levels, and consumer confidence is underwhelming. More avenues of opportunity will open over the spring and summer as the US recovers from the Covid-19 pandemic, likely prompting consumers to begin returning to pre-pandemic spending habits and meaning that retailers will face stiffer competition for the dollars of consumers. High savings now will translate to more spending firepower once the crisis is under control, increasing the amount of money to go around to both service providers and retailers in a more competitive economic landscape in the future.
Housing
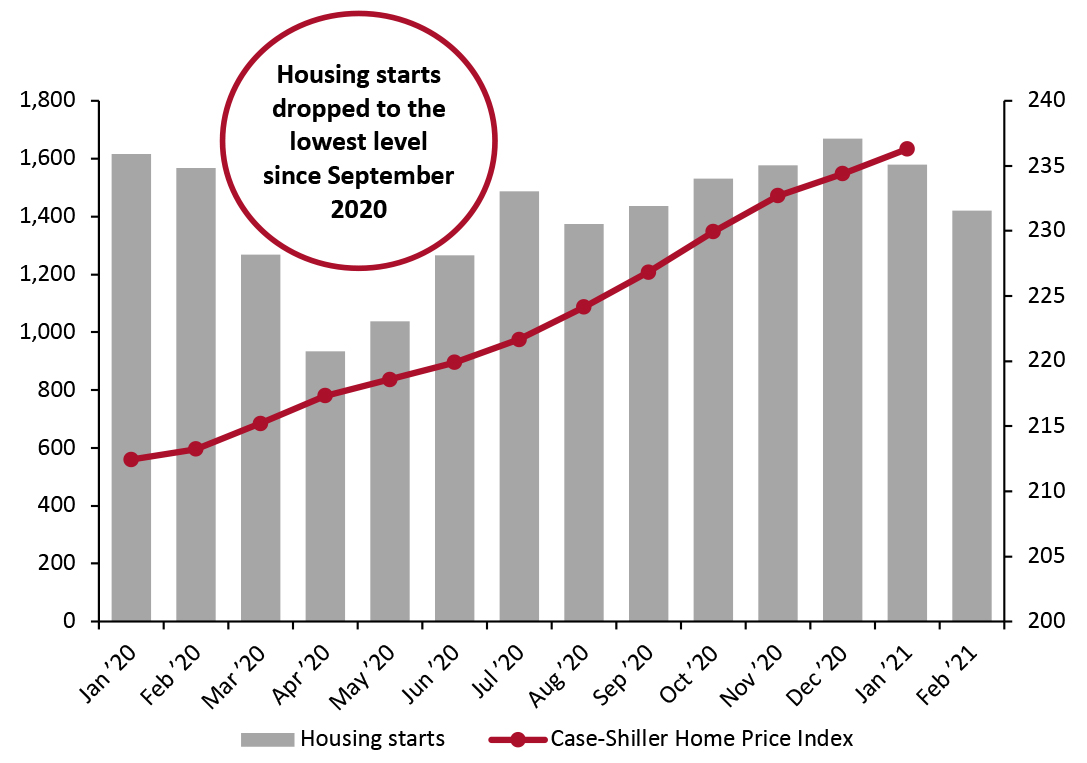
Continuing a trend that we identified in last month’s report, the pandemic-driven housing boom continued to fade through February 2021 as housing starts decreased for the second straight month to their lowest values since September 2020. Starts were down 9.3% year over year in February and around 15.0% since the peak in December 2020.
Source: US Energy Information Administration[/caption]
Implications
The savings rate remains above pre-pandemic levels, and consumer confidence is underwhelming. More avenues of opportunity will open over the spring and summer as the US recovers from the Covid-19 pandemic, likely prompting consumers to begin returning to pre-pandemic spending habits and meaning that retailers will face stiffer competition for the dollars of consumers. High savings now will translate to more spending firepower once the crisis is under control, increasing the amount of money to go around to both service providers and retailers in a more competitive economic landscape in the future.
Housing
Continuing a trend that we identified in last month’s report, the pandemic-driven housing boom continued to fade through February 2021 as housing starts decreased for the second straight month to their lowest values since September 2020. Starts were down 9.3% year over year in February and around 15.0% since the peak in December 2020.
Figure 10. Housing Starts (Left Axis) and Case-Shiller US Home Price Index (Right Axis) [caption id="attachment_125693" align="aligncenter" width="725"]
 Source: HUD/US Census Bureau[/caption]
Low interest rates should continue to make home buying attractive, but the sheer volume of movement during the height of the pandemic may have soaked up much of the demand for new houses for the time being. However, house prices continue to climb even as the market slows, in part due to consumers looking for inflation-proof assets amid growing fears of future inflation.
Implications
Slowing housing starts, combined with consumers getting out of the house more, should finally slow the growth of the home-improvement sector, which has thrived during the pandemic. The continued rise in house prices should embolden homeowning consumers to spend more, as the value of their assets increase and they perceive themselves as wealthier.
Source: HUD/US Census Bureau[/caption]
Low interest rates should continue to make home buying attractive, but the sheer volume of movement during the height of the pandemic may have soaked up much of the demand for new houses for the time being. However, house prices continue to climb even as the market slows, in part due to consumers looking for inflation-proof assets amid growing fears of future inflation.
Implications
Slowing housing starts, combined with consumers getting out of the house more, should finally slow the growth of the home-improvement sector, which has thrived during the pandemic. The continued rise in house prices should embolden homeowning consumers to spend more, as the value of their assets increase and they perceive themselves as wealthier.
What We Think
March retail sales are likely to be strong due to stimulus. Ongoing vaccination efforts and reopenings should see momentum continue later in the spring, with the economy likely to kick into full gear this summer. Implications for Brands/Retailers- As employment begins a second wave of recovery, retailers can finally expect to see an influx of spending from low-income workers who have been out of work through much of the crisis.
- In February, the University of Michigan Consumer Sentiment Index fell, but more recent measures of confidence globally show a rise in March. Consumers may be more optimistic about the economy, helping to boost spending across a wider variety of retail and service channels into the late spring and summer.
- Alongside a continually rising stock market, the steady rise in housing prices should boost spending among homeowning consumers who feel more financially secure as their assets rise in value.