
DIpil Das
Our US Monthly Retail Traffic and In-Store Metrics Report reviews year-over-year changes in selected store-based metrics, including sales, traffic and conversion rates.
US store-based traffic continued to fall in March, according to RetailNext. Retail traffic recorded a 7.9% decline year over year in March, faster than the 7.3% decline in February. The conversion rate (sales transactions as a percentage of traffic) fell 0.4 percentage points in March after advancing 0.4 percentage points in each of the previous two months. The rate of product returns declined 0.3 percentage points in March, after increasing 0.1 percentage points in February.
Average transaction value (ATV, sales divided by transactions) grew 3.3%, faster than the 1.8% growth reported in February. Shopper yield (sales divided by traffic) grew 0.5% year over year in March following a 7.5% and 2.7% increase in January and February, respectively. ATV and shopper yield showed year-over-year gains for the third consecutive month. ATV continued a seven-month growth streak.
Data for March showed that performance varied over the course of the five weeks: The week of March 23 performed best for sales, traffic and transactions, while March 6 week was the best for conversion. Traffic performed best in the second two weeks of the month with declines of only 4.6% and 3.8%, respectively.
All regions posted sales and traffic declines in March. The western part of the US registered the largest year-over-year decline in traffic at 8.7%, due to severe weather conditions (with snow peaking in March). The southern part of the US experienced the lowest decline in traffic, at 7.2%.
The west also recorded the largest year-over-year in-store sales decline, down 9.3%, while the northeast reported the smallest decline, down 4.7%, due to warmer temperatures compared to March 2018.
[caption id="attachment_84140" align="aligncenter" width="720"]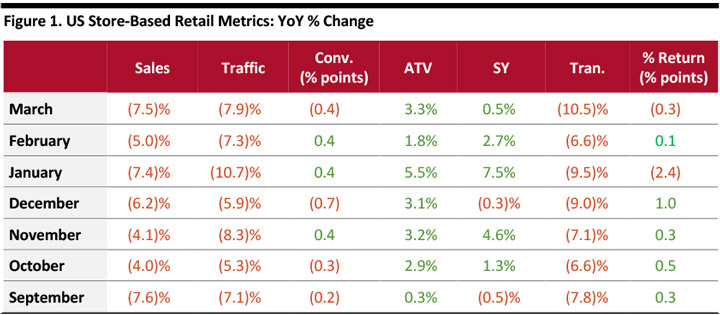 Conv. = conversion rate, ATV = average transaction value, SY = shopper yield, Tran. = number of transactions and %
Return = percentage of goods returned to stores
Source: RetailNext [/caption]
Conv. = conversion rate, ATV = average transaction value, SY = shopper yield, Tran. = number of transactions and % Return = percentage of goods returned to stores
Source: RetailNext [/caption]