albert Chan
US Retail Traffic and In-Store Metrics: June 2022
The Coresight Research US Retail Traffic and In-Store Metrics series reviews changes in selected store-based metrics, as reported by RetailNext. In this month’s report, we review store traffic changes through June 2022—which saw a decelerationn traffic growth at 2.9% compared to May’s 8.1% increase year over year. Year-over-year changes are our core metric for store-based data; however, June and July 2021 data in this report are compared to 2019 (pre-pandemic), because there were widespread store closures from April to July 2020 due to the Covid-19 crisis. From August 2021 onward, the comparison is made on a year-over-year basis.- In June, ATV (average transaction value, or sales divided by transactions) increased by 3.0%, 50 basis points (bps) higher than May’s growth of 2.5%, reflecting a trend toward the consolidation of shopping trips (fewer visits, larger baskets).
- Due to shoppers’ weaker intent to purchase, the conversion rate (sales transactions as a percentage of traffic) decreased by 0.4 percentage points in June, following May’s decline of 1.4 percentage points year over year.
- Shopper yield (sales divided by traffic) decreased by 0.8% in June, versus May’s 1.9% decline year over year.
- In June, the unit per transaction (number of items purchased divided by number of transactions) decreased by 0.1%, versus May’s 1.4% decline.
- The average unit retail (net sales divided by units sold) increased by 3.4% in June, lower than May’s 4.7% growth year over year.
Figure 1. US Store-Based Traffic and Sales: YoY % Change [caption id="attachment_151496" align="aligncenter" width="700"]
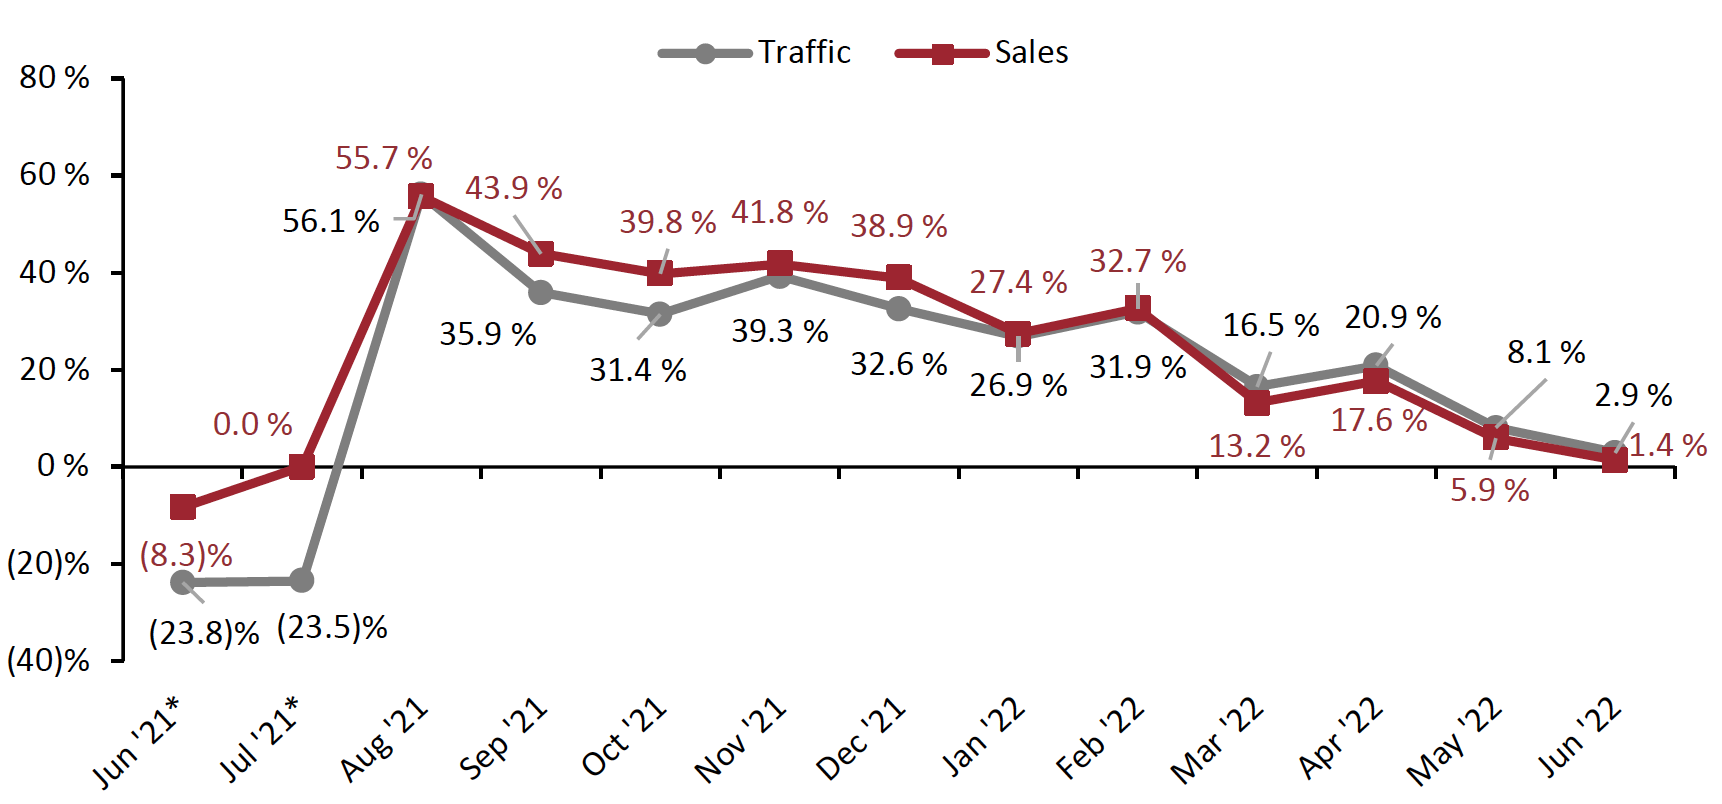 *June–July 2021 numbers are two-year % change due to store closures in the comparable period in 2020
Source: RetailNext[/caption]
Figure 2. US Store-Based Nonfood Retail Metrics: YoY % Change [caption id="attachment_151497" align="aligncenter" width="700"]
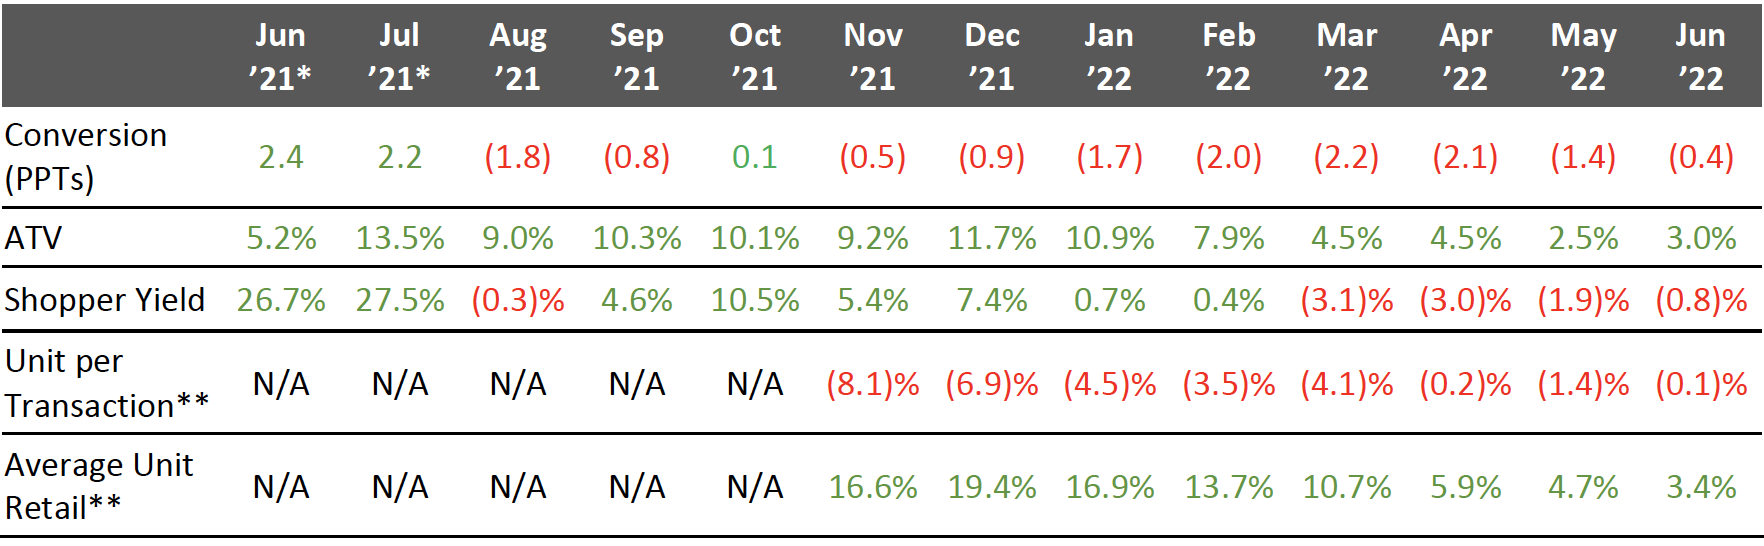 ATV=average transaction value; Shopper yield=sales divided by traffic
*June–July 2021 numbers are two-year % change due to store closures in the comparable period in 2020
**RetailNext started providing data on these from November 2021
Source: RetailNext[/caption] Weekly Shopper Traffic Trends Weekly data for June tracks the progress of store traffic over five weeks (May 29, 2022–July 2, 2022):
- On a week-by-week basis, traffic performance displayed a mixed trend as the month progressed, recording the strongest performance in the first and second weeks. Traffic increased by 5.6% in both the first and second, an acceleration from the final week of May, which saw a traffic increase of 4.6%, attributed to shopping on Sundays leading up to Memorial Day on May 30.
- The fourth week saw traffic growth of 3.2% year over year, driven by Father’s Day on June 19 and the public holiday of Juneteenth (Monday, June 20).
- The third week witnessed flat growth, while the fifth week saw soft traffic growth of 0.2% year over year, respectively.
- Apparel was the best-performing category and saw a traffic increase of 5.8% year over year, although this is 1,200 bps lower than May. The first week witnessed the highest traffic trends, with traffic increasing by 10.0% while the fifth week saw the lowest traffic trend at 1.7% year over year.
- Health and beauty performed second best in traffic trends, increasing by 4.2% year over year—about 620 bps lower than May, nevertheless. The second week saw the highest traffic trend in the category, with an increase of 8.1% year over year.
- Footwear saw a traffic increase of 3.3% on a year-over-year basis, 1,100 bps lower than May. The first week witnessed the strongest traffic growth, of 14.7% year over year.
- Traffic in the jewelry category increased by 1.6% year over year—a decrease of 360 bps from May. Traffic trends consistently declined throughout the month for the category, from the first week’s traffic increase of 4.1% to the fifth week’s traffic decline of 1.4% year over year.
- The home category saw the weakest traffic trends in June, with a 15.0% decrease year over year. The fourth week witnessed the strongest traffic trends, with traffic declining by 13.5% while the fifth week saw the weakest traffic trend, with a decline of 16.5% year over year.
Figure 3. US Retail Traffic by Industry Vertical: YoY % Change [caption id="attachment_151498" align="aligncenter" width="700"]
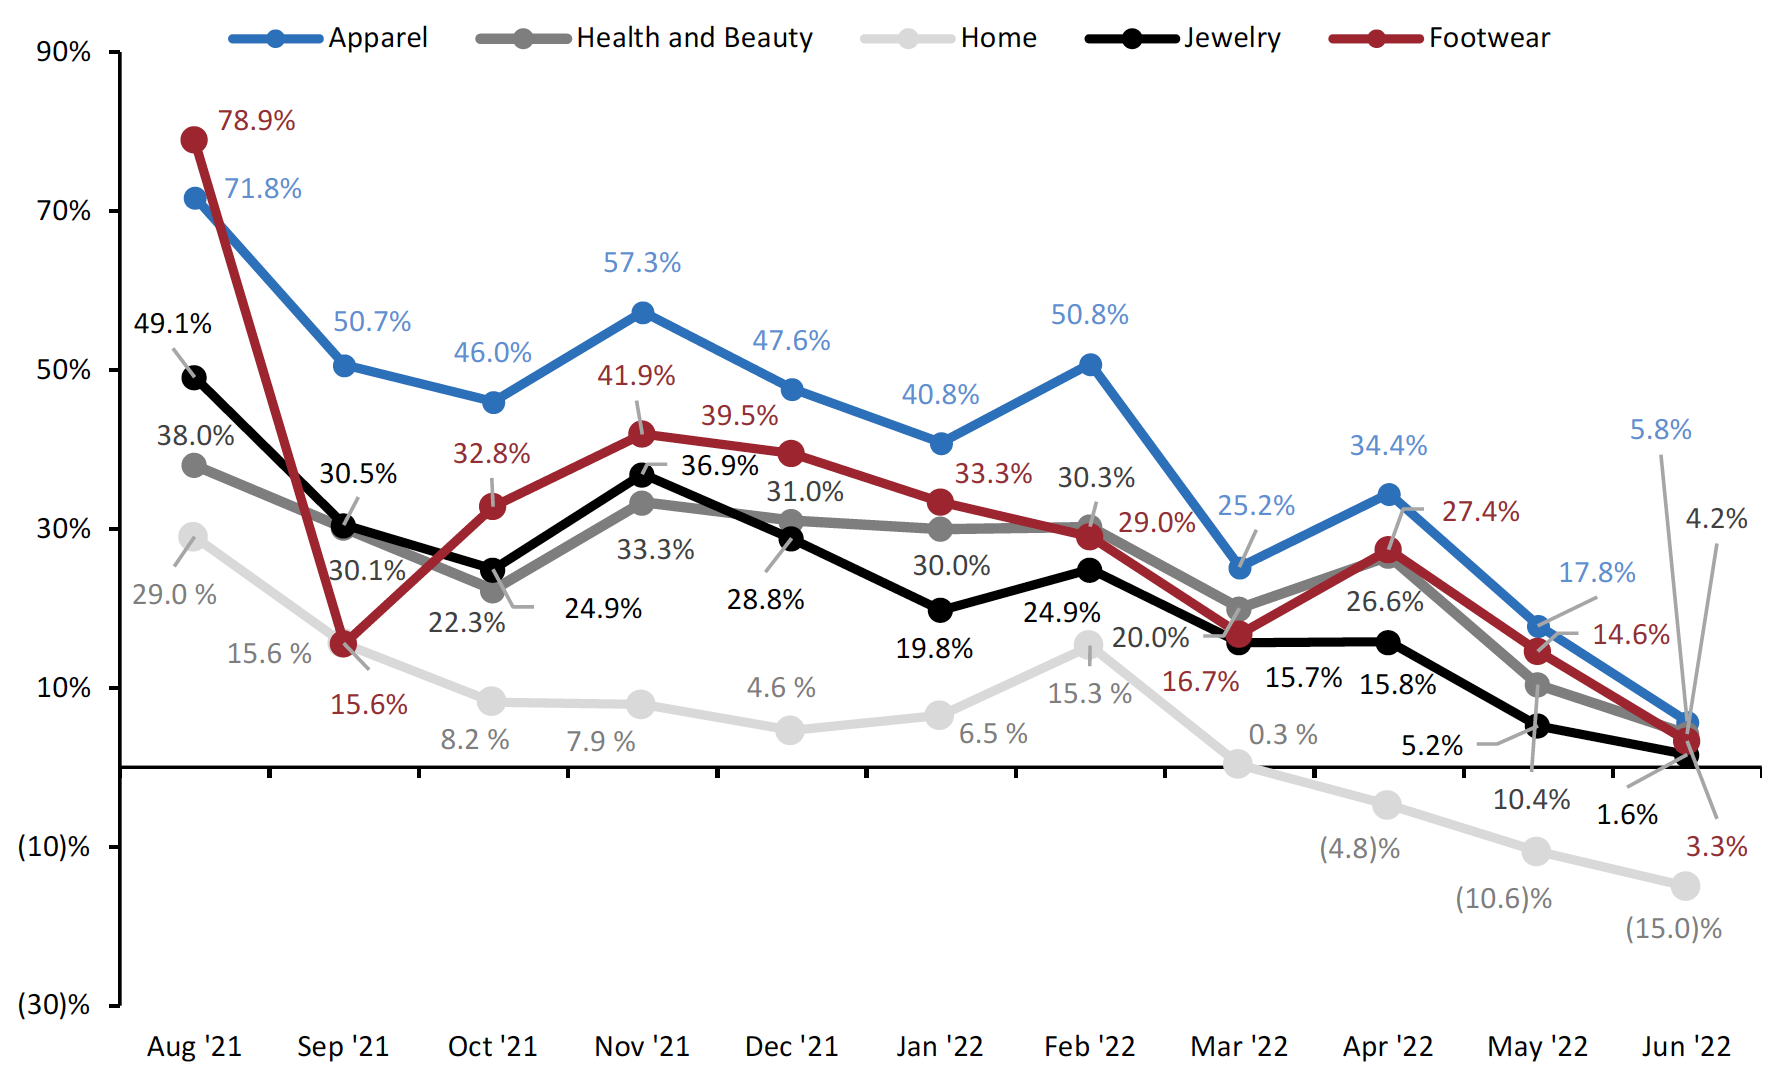 RetailNext started providing traffic trends by vertical on a year-over-year basis from August 2021
Source: RetailNext[/caption] Regional Traffic Trends In June, the number of Covid-19 cases in the US continued to rise—reaching five times higher compared to the same month last year according to the CDC (Centre for Disease Control and Prevention), impacting traffic trends. This was offset partially by the beginning of summer travel and vacation plans, which are expected to pick up again in the next month. Retail traffic in June varied across regions.
- The Northeast region was the best performer, with an increase of 9.2% year over year. The second week witnessed the highest traffic trends, followed by the fourth week. Traffic on Father’s Day (June 19) increased by 15.7% year over year. Traffic increased by 45.0% year over year on June 20, which was officially established as a federal holiday for Juneteenth in 2021. The increase in traffic was mainly due to lifting of Covid restrictions as cases declined compared to June 2021.
- The West region performed second best, with traffic increasing by 3.1%—lower than May’s 8.4% growth year over year, however. Traffic was highest during the first week and declined throughout the month, with a spike in the fourth week. Traffic on Juneteenth increased by 22.0% compared to 2021. Traffic increased by 7.7% year over year on Father’s Day (June 19) amid the absence of Covid-19 restrictions this year.
- In June, the Midwest region experienced a flat traffic trend, increasing by 0.2% year over year. The first two weeks witnessed the strongest traffic before declining throughout the rest of the month. Traffic on Juneteenth increased by 19.0%, while traffic on Father’s Day declined by 4.1% year over year.
- The South region experienced the softest traffic in June, declining by 2.4% year over year. The third week had the lowest traffic with a 6.5% decline year over year. Traffic on Juneteenth increased by 14.0% compared to 2021. On Father’s Day, traffic declined by 1.4% year over year.
Traffic by Retailer Location Type
In June, non-mall traffic trends outperformed mall traffic trends, increasing by 7.4% and 0.8%, respectively, year over year. Outdoor traffic trends performed better in June, with an increase of 2.2%, while indoor traffic trends performance was flat as compared to 2021.
- Traffic by location type increased between 0.1% and 8.3% year over year.
- Outlet locations outperformed all other location types, increasing by 8.3% year over year.
- Street-front/freestanding locations performed second best, with traffic increasing by 6.5%, followed by lifestyle centers, which saw a 2.4% traffic increase year over year.
- Other locations, including airports, casinos, and hotels, reported traffic growth of 2.2% while luxury saw traffic growth of 0.9% year over year.