DIpil Das
US Retail Sales: June 2022
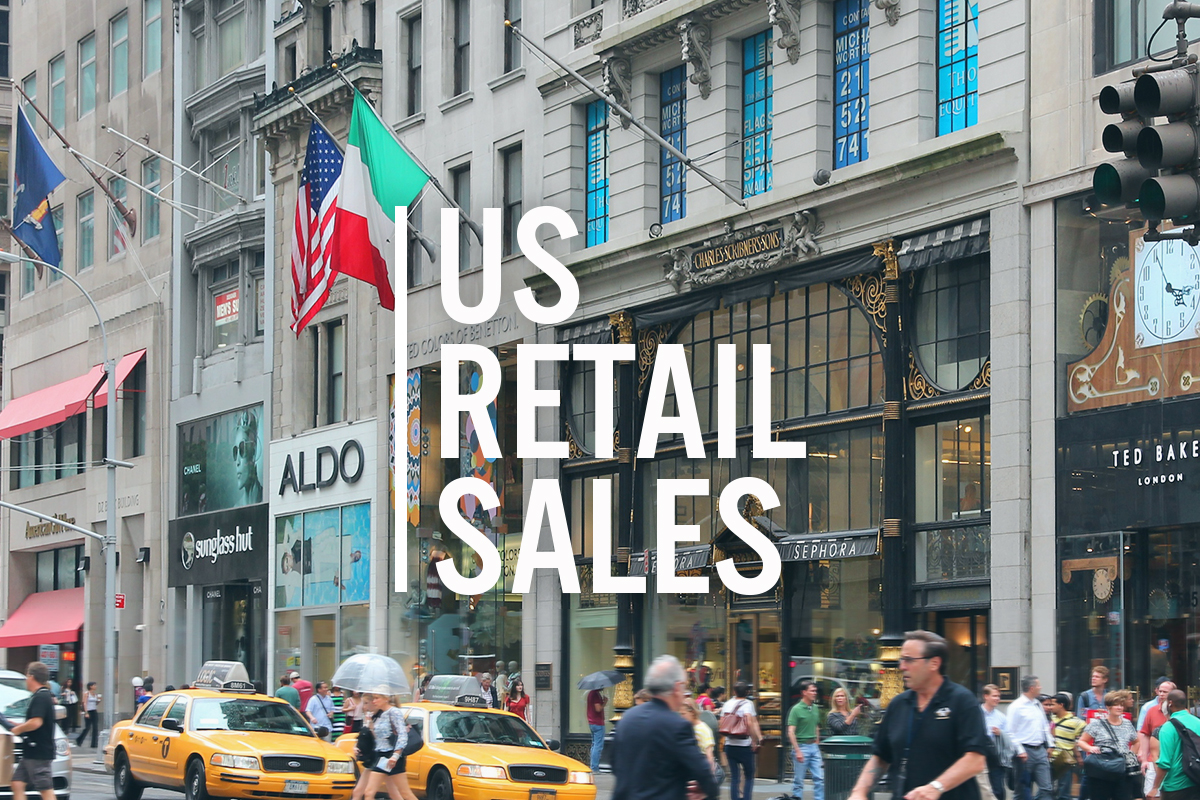
Coresight Research’s measure of core retail sales is the unadjusted year-over-year change, excluding sales of gasoline, motor vehicles and parts. This metric was in line with our expectations as outlined in our latest Leading Indicators of US Retail Sales Report, growing 5.6% year over year. Furthermore, the Census Bureau’s adjustments to April retail sales estimates revised growth downward, from 6.5% year-over-year growth to 6.1%.
June 2022 retail sales estimates indicate that consumer spending is continuing to persist through inflation. The 5.6% growth in total retail sales is on top of the 13.8% growth in June 2021. However, the retail sales estimates released by the US Census Bureau do not account for inflation. In June, consumer prices grew 9.1% from a year ago, climbing to a 41-year high. Price increases are being driven by essential goods, such as household energy, gasoline and food at home. While sales at gasoline stations are not included in our metric of retail sales, the price of gas is putting pressure on consumers’ ability to spend in discretionary categories. In a more positive light, we anticipate automotive fuel price inflation to have peaked in June owing to the strongest month of seasonal demand for summer travel. We have seen early indications to support this assertion. The average price of gas per gallon in the US peaked the week of June 13 at $5.01 per gallon; since then the average price of gas per gallon has been declining and currently stands at $4.65 as of the week of July 11. Since automotive fuel price inflation has been one of the larger drivers of overall inflation, if fuel prices hit a peak in June, it could indicate we have also reached our inflationary peak and we could see start to see easing consumer price index increases.
We estimate our retail-only inflation metric to have been 7.6% in June. This metric strips out some of the core categories driving overall inflation and focuses on price increases within relevant retail-specific sectors, each of which are weighted to represent their share of total retail sales. With our inferred retail-only inflation metric at 7.6%, 5.6% overall growth in retail sales in June implies consumers are buying fewer items at the store and there was a real terms sales decline of around 2.0%. We estimate that June was the fourth consecutive month to see a real-terms total sales decline, year over year.
Furthermore, June’s acceleration in consumer price increases means that despite interest rate hikes, inflation has yet to cool off. Consequently, at the end of June, the University of Michigan consumer sentiment index declined to its lowest recorded reading in history, to a reading of 50.0. On June 15, the Federal Reserve Bank hiked interest rates by 75 basis points, the largest such hike since 1994, and a more aggressive monetary policy action than its previous 50-basis point hike plan laid out earlier in the year. In response to June’s consumer price increases, the Federal Reserve is considering hiking interest even steeper.
Figure 1. US Total Retail Sales ex. Gasoline and Automobiles: YoY % Change [caption id="attachment_151552" align="aligncenter" width="700"]
 Data are not seasonally adjusted
 Source: US Census Bureau/Coresight Research [/caption]
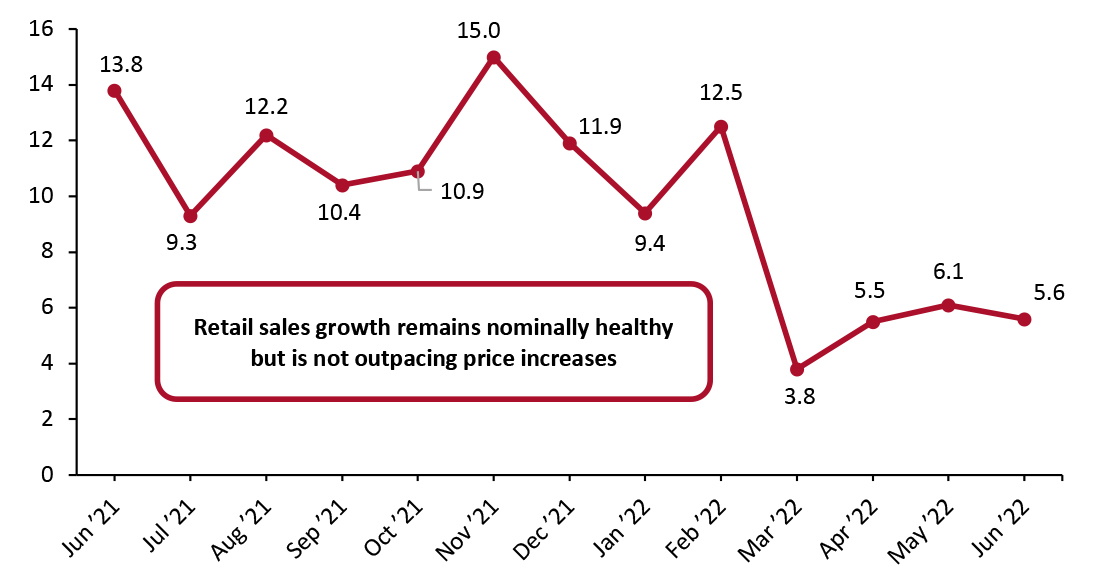
Seasonally adjusted retail sales, including automobiles and gasoline, grew slower at 7.7% from a year ago. Sales at gasoline stations are artificially surging as a result of higher prices. However, sales at motor vehicles and auto parts dealers did not grow, reflecting the impact of the combination of the global microchip shortage and rising prices of new and used vehicles.
Figure 2. US Total Retail Sales incl. Gasoline and Automobiles: Seasonally Adjusted YoY % Change [caption id="attachment_151553" align="aligncenter" width="700"]
 Data are seasonally adjusted
 Source: US Census Bureau/Coresight Research [/caption]
Sales Marginally Decline Month over Month
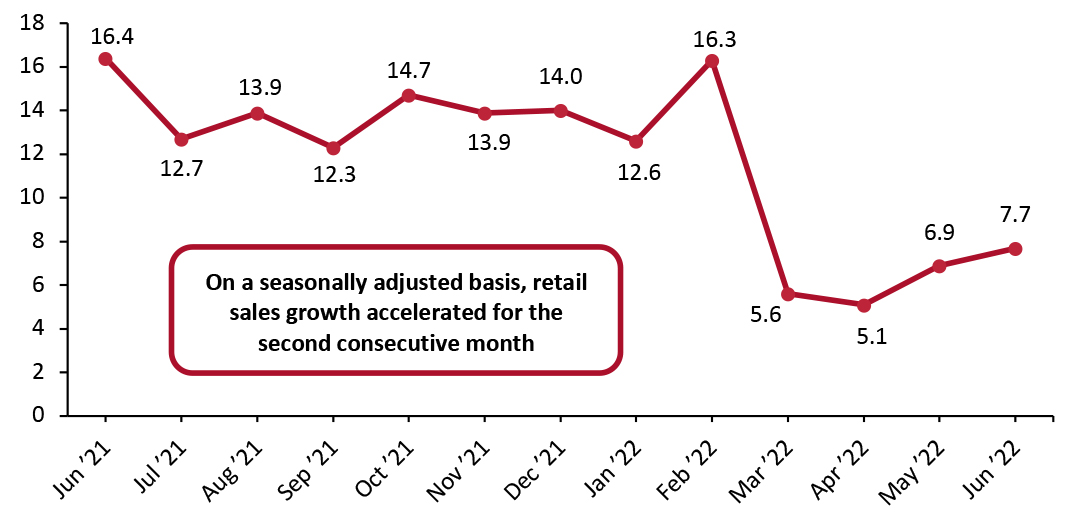
On a month-over-month basis, seasonally adjusted sales (excluding gasoline and automobiles) accelerated in June after a weak May. The month-over-month acceleration in retail sales indicates that consumer spending persevered in June through a 41-year high inflationary context.
Figure 3. US Total Retail Sales ex. Gasoline and Automobiles: MoM % Change [caption id="attachment_151554" align="aligncenter" width="700"]
 Data are seasonally adjusted
 Source: US Census Bureau/Coresight Research [/caption]
Retail Sales Growth by Sector
Overall retail sales growth stayed nominally healthy. Some notable sectors are witnessing sales growth slow as consumers grapple with the fastest rising prices in four decades, while three notable sectors witnessed sales declines.
- Sales at electronics and appliance stores saw a fourth consecutive month of sales declines. Year over year, sales declines accelerated once more. In June, sales declined by 8.7% from a year ago.
- General merchandise stores saw healthier sales growth in June. Sales grew 2.1% from the previous year ago, an acceleration from May’s marginal 1.1% growth in sales. Meanwhile, the department store subsector saw a second consecutive month of sales declines, although this month’s decline was lower than last month’s; sales at departments stores declined 0.8% from a year ago.
- This month, sales at health and personal care stores turned negative. Sales declined 0.5% from the previous year, marking a quick drop-off from May’s 4.6% year-over-year growth in sales.
- Sales of building material and garden supplies had a second consecutive healthy month with sales growing 6.7% from the previous year.
- Relatedly, sales growth of furniture and home-furnishings accelerated to 4.8%, up from May’s 2.2% year-over-year growth.
- Food and beverage stores sales nominally grew 7.5% from the previous year, while grocery stores did a bit better, growing 8.9% from the previous year. Still, neither of these two sectors are seeing sales outpace food at home price increases, which continued to accelerate to 12.2% from a year ago, as sales volumes continue to decline.
- Apparel sales growth slowed in June. While staying marginally healthy, sales grew just 0.2%, down from May’s 3.7% year-over-year growth in sales.
- Miscellaneous store retailers continue to see the strongest sales growth of any sector throughout 2022, although sales growth did ease in June. Sales grew 15.1% from the previous year and this is down from a strong month of May when sales grew 25.2% from the previous year.
- Nonstore retailers, a proxy for e-commerce spending, stayed healthy with sales growing 9.6% year over year.
- Sales at sporting goods, hobby, musical instrument and bookstores grew 2.4%, a slight acceleration from May’s 1.5% growth in sales.
- While it is not included in our definition of retail sales, the Census Bureau’s report of a 13.7% year-over-year rise in sales at food service and drinking establishments in May reflects the sustained shift back to public places and services spending.
Figure 4. US Total Retail Sales, by Sector: YoY % Change [wpdatatable id=2127]
Data are not seasonally adjusted Source: US Census Bureau/Coresight Research