albert Chan
Introduction
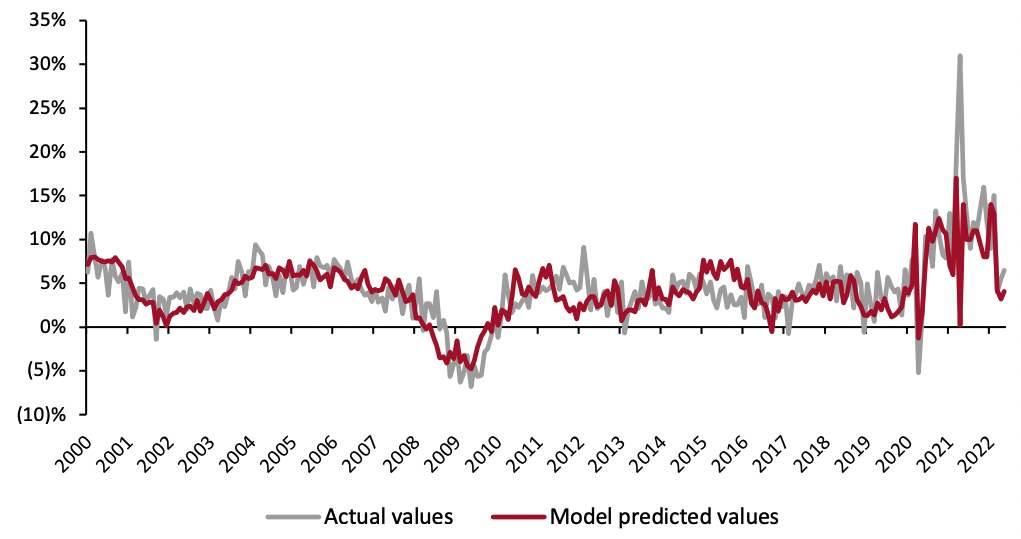
What’s the Story? In our Leading Indicators of US Retail Sales monthly series, we examine several key macroeconomic indicators and analyze how they may impact retail sales in the coming months. We analyze the latest available data as of June 27, from various sources, including the US Census Bureau, the US Bureau of Economic Analysts (BEA), the US Bureau of Labor Statistics (BLS), the US Department of Housing and Urban Development (HUD) and the Federal Reserve Bank of St. Louis. Why It Matters Macroeconomic indicators have a significant impact on overall retail sales growth. Looking at 10 indicators (unemployment rate, labor force participation rate, disposable income per capita, average hourly wages, consumer sentiment, saving rate, gas price, federal funds rate, housing starts and housing prices), we can historically account for much of the variation in retail sales growth and create a strong basis for predicting sales moving forward. The close correlation between retail sales growth predictions based on economic indicators and actual retail sales growth is shown in Figure 1.Figure 1. US Actual Retail Sales (ex. Auto and Gas Sales) vs. Model Predicted Sales (YoY % Change) [caption id="attachment_150512" align="aligncenter" width="700"]
 Through May 2022
Source: BEA/BLS/Federal Reserve Board of Governors/S&P/Coresight Research[/caption] During the first five months of 2022, retail sales growth performed strongly against the backdrop of 40-year high consumer prices. In May, retail sales growth further accelerated from a downwardly revised April estimate. Despite healthy retail sales growth, consumer price increases accelerated once more in May, reaching a new 40-year high, prompting the Federal Reserve Bank to implement a 75 basis-point interest rate hike, the steepest hike since 1994. In attempts to get inflation under control, the Federal Reserve Bank will have to raise rates high enough to deliberately slow the long-term growth of the economy. The interest rate hike has already cut into the wealth effect consumers felt throughout the pandemic and is likely to continue to do so. Hence, we have a more modest outlook for retail sales growth as we head towards the halfway point of 2022.
Leading Indicators of US Retail Sales: Coresight Research Analysis
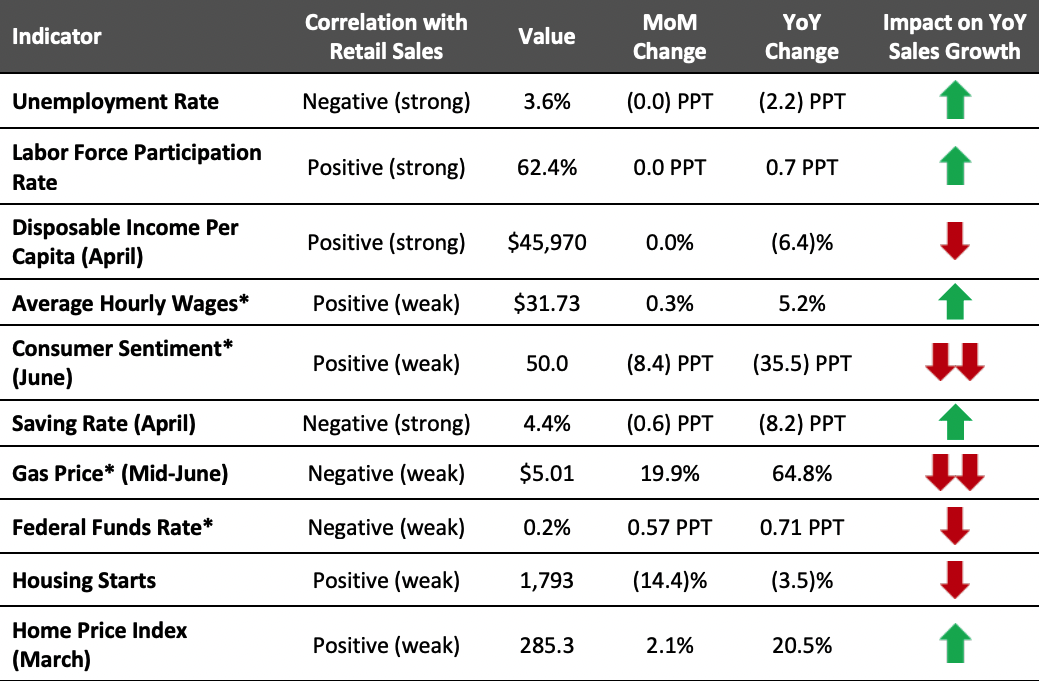
Indicators Overview Five of the 10 indicators we examined are likely to positively impact retail sales in the coming months. In March, the unemployment rate ticked down further, while the labor force participation rate continued to see slow-but-steady gains. Average hourly wage growth picked up again after moderating in February. Meanwhile, consumer sentiment began to improve as US gas prices began to ease due to the release of a million barrels of oil per day from the Strategic Petroleum Reserve. Inflation in aggregate remains high, and consumers are beginning to push back against rising prices.Figure 2. US: Leading Indicators of Retail Sales as of June 27, 2022 [caption id="attachment_150513" align="aligncenter" width="700"]
 Latest available data from May unless otherwise indicated
*Not included in predictive model
Source: BEA/BLS/Federal Reserve Board of Governors/S&P/University of Michigan/US Energy Information Administration/Coresight Research[/caption] Our model, which analyzes correlations between retail sales and macroeconomic indicators, predicts a modest outlook for retail sales growth in June, at 5.5%. Furthermore, our model projects that July will tell a similar story, with retail sales growing 5.8% from the previous year. These estimates are against strong comparatives from June and July 2021, when a boost to spending from stimulus checks distributed in March of 2021 elevated retail sales growth—US retail sales grew 13.2% in June 2021 and 9.0% in July 2021. The continued modest sales growth is what we expect to see entering the peak summer months. This is the summer of experiences as consumers unleash their pent-up demand to travel, redirecting spending away from goods and back towards services. Other headwinds to sales growth include the rising prices of essentials, such as gas and energy, and increasing interest rates.
Figure 3. US Retail Sales ex. Auto and Gas (YoY % Change) [caption id="attachment_150514" align="aligncenter" width="700"]
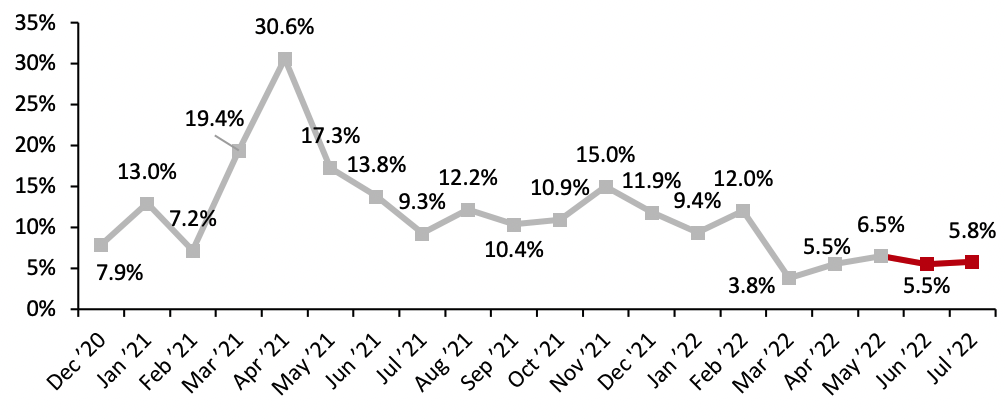 Source: US Census Bureau/Coresight Research[/caption]
The Job Market
In May, the US added 390,00 jobs to nonfarm payrolls, better than the 328,000 estimated by the Dow Jones. In May, leisure and hospitality, professional and business services, and transportation and warehousing sectors led overall job creation. Meanwhile, the retail sector lost workers. Retail trade employment declined by 61,000 workers but remained 159,000 workers above its pre-pandemic value. The largest losses occurred in general merchandise stores (-33,000), clothing and clothing accessory stores (-9,000), food and beverage stores (-8,000), building material and garden supply stores (-7,000) and health and personal care stores (-5,000), according to the BLS.
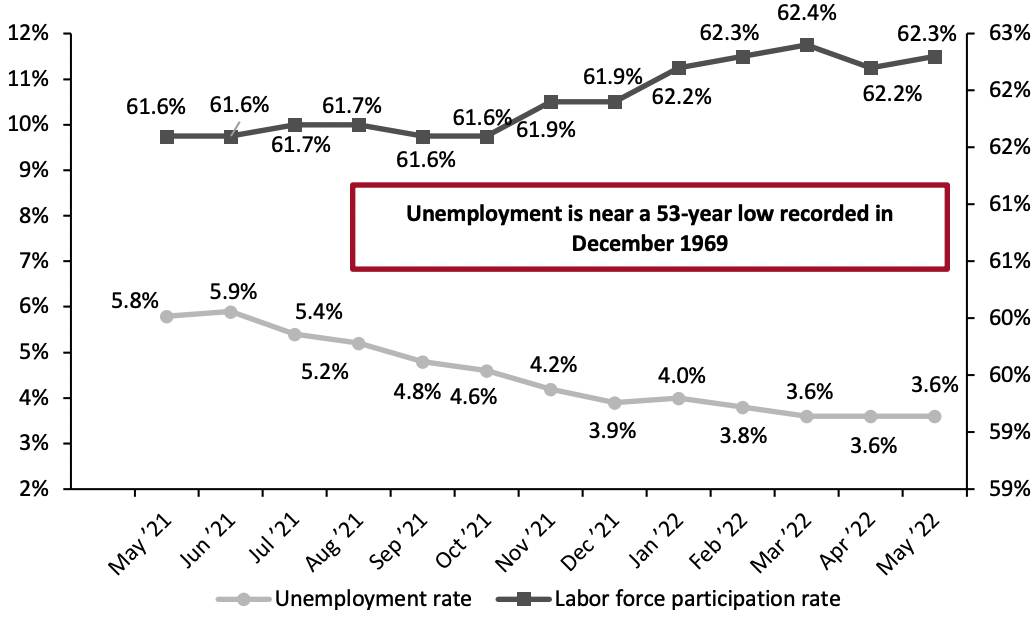
The unemployment rate remained unchanged. At 3.6%, the current unemployment sits below the unemployment rate needed for the economy to be at “full-employment” (5%). Meanwhile, at 62.3%, the labor force participation rate is 1.1 PPTs below its pre-pandemic value, meaning the US economy has yet to recover the labor losses incurred during the pandemic. The demand for labor remains high—in April, there were 11.4 million job openings and only 6.6 million hires, according to the latest available data from the Job Openings and Labor Turnover (JOLT) survey. Furthermore, the “Great Resignation” remains in effect: 4.4 million people quit their jobs in April, nearly a record high.
Source: US Census Bureau/Coresight Research[/caption]
The Job Market
In May, the US added 390,00 jobs to nonfarm payrolls, better than the 328,000 estimated by the Dow Jones. In May, leisure and hospitality, professional and business services, and transportation and warehousing sectors led overall job creation. Meanwhile, the retail sector lost workers. Retail trade employment declined by 61,000 workers but remained 159,000 workers above its pre-pandemic value. The largest losses occurred in general merchandise stores (-33,000), clothing and clothing accessory stores (-9,000), food and beverage stores (-8,000), building material and garden supply stores (-7,000) and health and personal care stores (-5,000), according to the BLS.
The unemployment rate remained unchanged. At 3.6%, the current unemployment sits below the unemployment rate needed for the economy to be at “full-employment” (5%). Meanwhile, at 62.3%, the labor force participation rate is 1.1 PPTs below its pre-pandemic value, meaning the US economy has yet to recover the labor losses incurred during the pandemic. The demand for labor remains high—in April, there were 11.4 million job openings and only 6.6 million hires, according to the latest available data from the Job Openings and Labor Turnover (JOLT) survey. Furthermore, the “Great Resignation” remains in effect: 4.4 million people quit their jobs in April, nearly a record high.
Figure 4. US Unemployment Rate (Left Axis, %) and Labor Force Participation Rate (Right Axis, %) [caption id="attachment_150515" align="aligncenter" width="700"]
 Source: BLS[/caption]
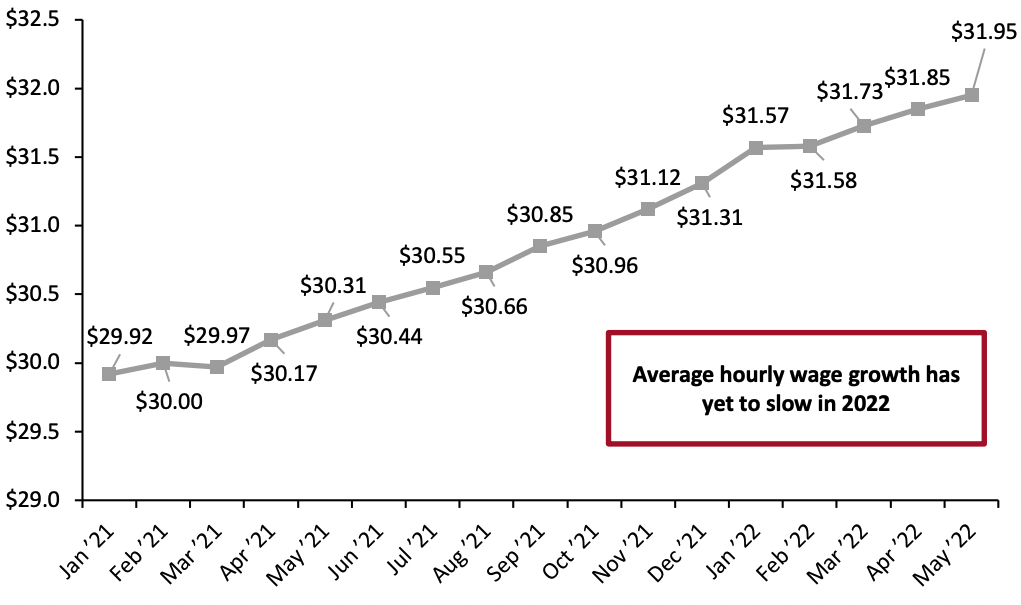
Average hourly wage growth continues to move upwards within a tight labor market. Average hourly wages increased by $0.10 month over month, representing 5.2% year-over-year growth. The increase may be small in dollar terms but is significant when considering the size of the US workforce.
Source: BLS[/caption]
Average hourly wage growth continues to move upwards within a tight labor market. Average hourly wages increased by $0.10 month over month, representing 5.2% year-over-year growth. The increase may be small in dollar terms but is significant when considering the size of the US workforce.
Figure 5. US Average Hourly Wages, All Private-Sector Employees (USD) [caption id="attachment_150516" align="aligncenter" width="700"]
 Source: BLS[/caption]
Implications
While the month of May brought a better-than-expected jobs report, the total number of jobs created represents the slowest month of job creation since April 2021. For the moment, workers remain in high demand as businesses struggle to fill vacancies. However, this could change soon, likely after the summer months. With fears of an oncoming recession rising, the Federal Reserve Bank is hiking interest rates high enough to deliberately slow the longer-term growth of the US economy. For the moment, layoffs have been few and far between; however, businesses are now considering the benefits of hiring extra workers versus the costs of doing so amid current economic uncertainty.
Year-to-date, stock markets have not performed well and have responded poorly to climbing interest rates. If the US is to head into a recession, the declining market performance could pull some early retirees back into the labor force, especially if their income is reliant on their IRA portfolio’s performance.
Income, Savings and Sentiment
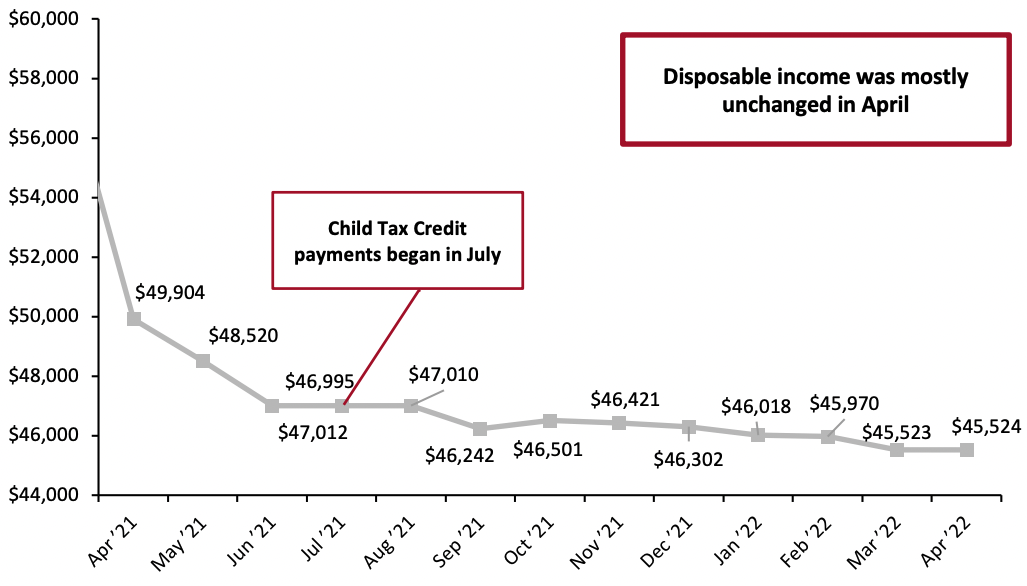
In April (latest available data), real disposable income per capita was mostly unchanged, increasing by just $1.00. The general downward movement in disposable income per capita since March 2021—when the third round of stimulus boosted disposable income—reflects a positive sign for consumer spending in the short term. Consumer spending continues to persist through the 40-year-high inflationary context, driven by pandemic-led savings.
Source: BLS[/caption]
Implications
While the month of May brought a better-than-expected jobs report, the total number of jobs created represents the slowest month of job creation since April 2021. For the moment, workers remain in high demand as businesses struggle to fill vacancies. However, this could change soon, likely after the summer months. With fears of an oncoming recession rising, the Federal Reserve Bank is hiking interest rates high enough to deliberately slow the longer-term growth of the US economy. For the moment, layoffs have been few and far between; however, businesses are now considering the benefits of hiring extra workers versus the costs of doing so amid current economic uncertainty.
Year-to-date, stock markets have not performed well and have responded poorly to climbing interest rates. If the US is to head into a recession, the declining market performance could pull some early retirees back into the labor force, especially if their income is reliant on their IRA portfolio’s performance.
Income, Savings and Sentiment
In April (latest available data), real disposable income per capita was mostly unchanged, increasing by just $1.00. The general downward movement in disposable income per capita since March 2021—when the third round of stimulus boosted disposable income—reflects a positive sign for consumer spending in the short term. Consumer spending continues to persist through the 40-year-high inflationary context, driven by pandemic-led savings.
Figure 6. US Annualized Real Disposable Income Per Capita (USD) [caption id="attachment_150517" align="aligncenter" width="700"]
 Source: BEA[/caption]
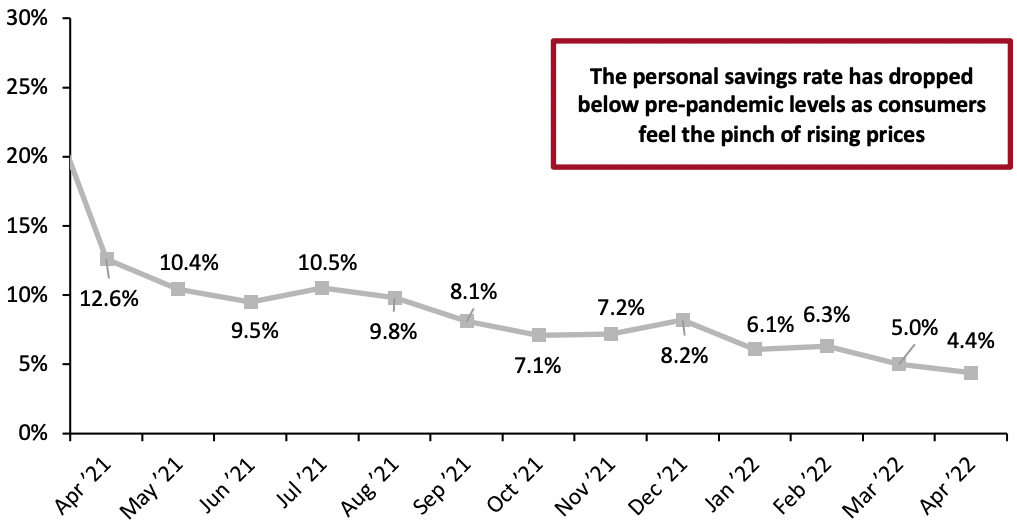
The personal savings rate continued to move downward in April, declining by 0.6 PPTs month over month. The personal savings rate is 8.2 PPTs lower than a year ago, although this is against elevated savings during the pandemic. Compared to pre-pandemic February 2020, the personal savings rate is 3.9 PPTs lower, reflecting the impact of 40-year high inflation. Consumers are spending most of their paychecks on keeping up with the prices of essential goods such as food, gas and utilities.
Source: BEA[/caption]
The personal savings rate continued to move downward in April, declining by 0.6 PPTs month over month. The personal savings rate is 8.2 PPTs lower than a year ago, although this is against elevated savings during the pandemic. Compared to pre-pandemic February 2020, the personal savings rate is 3.9 PPTs lower, reflecting the impact of 40-year high inflation. Consumers are spending most of their paychecks on keeping up with the prices of essential goods such as food, gas and utilities.
Figure 7. Personal Saving Rate (%) [caption id="attachment_150518" align="aligncenter" width="700"]
 Source: BEA[/caption]
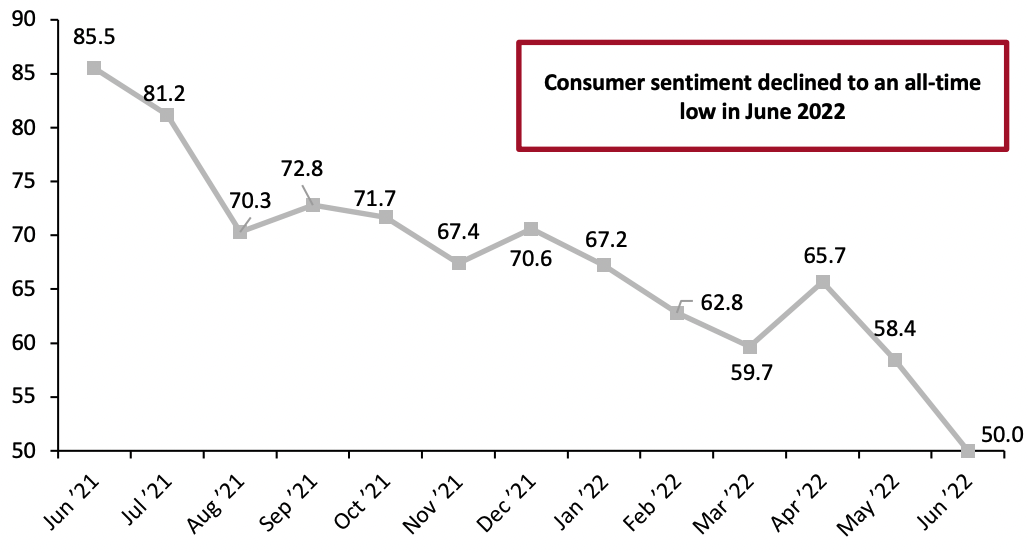
In the final week of June, consumer sentiment hit a record low. Since the inception of the University of Michigan Consumer Sentiment Index in the mid-1970s, consumer sentiment has never been as low as it currently is, sitting at 50.0. Record-low consumer sentiment is a result of inflation acceleration in May and uncertainty regarding the economy’s future.
Source: BEA[/caption]
In the final week of June, consumer sentiment hit a record low. Since the inception of the University of Michigan Consumer Sentiment Index in the mid-1970s, consumer sentiment has never been as low as it currently is, sitting at 50.0. Record-low consumer sentiment is a result of inflation acceleration in May and uncertainty regarding the economy’s future.
Figure 8. University of Michigan Consumer Sentiment Index [caption id="attachment_150519" align="aligncenter" width="700"]
 Source: University of Michigan[/caption]
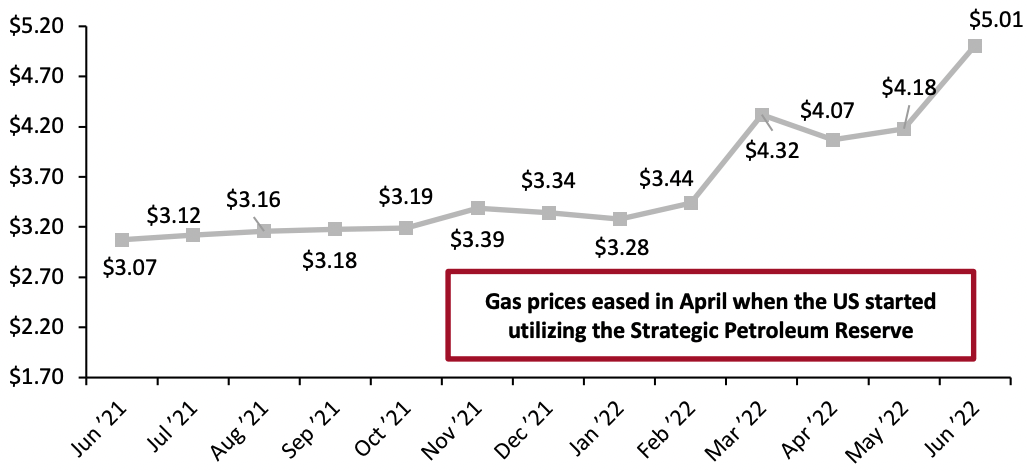
In April, the average per-gallon gas price in the US started to ease because of the Biden Administration’s utilization of Strategic Petroleum Reserves. However, we have entered the peak summer travel season, and demand has again outpaced the supply of gas in the US, moving prices upwards. In mid-June, the average per-gallon gas price in the US eclipsed the $5.00 mark for the first time in history. As of June 13, the average per-gallon gas price stood at $5.01, reflecting 20% growth from the previous month and a 65% year-over-year increase.
Source: University of Michigan[/caption]
In April, the average per-gallon gas price in the US started to ease because of the Biden Administration’s utilization of Strategic Petroleum Reserves. However, we have entered the peak summer travel season, and demand has again outpaced the supply of gas in the US, moving prices upwards. In mid-June, the average per-gallon gas price in the US eclipsed the $5.00 mark for the first time in history. As of June 13, the average per-gallon gas price stood at $5.01, reflecting 20% growth from the previous month and a 65% year-over-year increase.
Figure 9. US Regular All Formulations Gas Price (Dollars per Gallon) [caption id="attachment_150520" align="aligncenter" width="700"]
 Source: US Energy Information Administration[/caption]
Implications
Higher gasoline prices have a multiplier effect throughout the economy, impacting the cost of goods delivery and personal travel. With gas prices at their highest level in over a decade and inflation remaining high, consumers’ spending power is diminished. We expect gas prices will continue to climb in June and potentially keep climbing in July as they are the peak travel months of the summer. Once we enter the back-to-school season and seasonal demand for travel declines, we may begin to see some easing of gas prices.
Housing
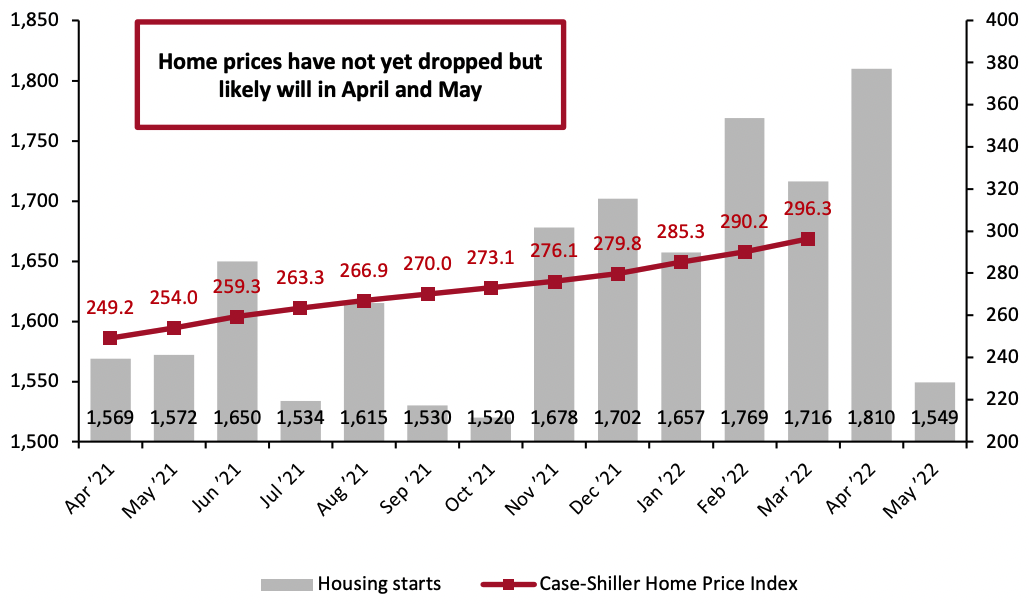
Housing starts declined in May due to rapidly climbing mortgage rates, a direct consequence of the Federal Reserve’s interest rate hike. In the week of June 23, the average 30-year fixed mortgage rate rose to 5.81%—a 2.8% year-over-year increase—the highest rate since November 2008 (during the US housing crisis). With mortgage rates climbing, demand for new housing has fallen sharply. In April (latest available data), sales of new houses in the US fell 26.9% from the previous year, according to US Census Bureau data. Now, with the housing market showing signs of cooling off, new housing starts have begun to drop.
Home prices continued to climb in March (the latest month for which Case-Shiller Index data is available), reaching 296.3 points, up from 290.2 points in February. Rising home prices can create a wealth effect, making consumers feel more affluent and emboldening them to spend. However, we believe housing prices will likely have fallen in April and May, reflecting declining demand for new home purchases as mortgage rates climb.
Source: US Energy Information Administration[/caption]
Implications
Higher gasoline prices have a multiplier effect throughout the economy, impacting the cost of goods delivery and personal travel. With gas prices at their highest level in over a decade and inflation remaining high, consumers’ spending power is diminished. We expect gas prices will continue to climb in June and potentially keep climbing in July as they are the peak travel months of the summer. Once we enter the back-to-school season and seasonal demand for travel declines, we may begin to see some easing of gas prices.
Housing
Housing starts declined in May due to rapidly climbing mortgage rates, a direct consequence of the Federal Reserve’s interest rate hike. In the week of June 23, the average 30-year fixed mortgage rate rose to 5.81%—a 2.8% year-over-year increase—the highest rate since November 2008 (during the US housing crisis). With mortgage rates climbing, demand for new housing has fallen sharply. In April (latest available data), sales of new houses in the US fell 26.9% from the previous year, according to US Census Bureau data. Now, with the housing market showing signs of cooling off, new housing starts have begun to drop.
Home prices continued to climb in March (the latest month for which Case-Shiller Index data is available), reaching 296.3 points, up from 290.2 points in February. Rising home prices can create a wealth effect, making consumers feel more affluent and emboldening them to spend. However, we believe housing prices will likely have fallen in April and May, reflecting declining demand for new home purchases as mortgage rates climb.
Figure 10. Housing Starts (Thousands, Left Axis) and Case-Shiller US Home Price Index (Right Axis) [caption id="attachment_150521" align="aligncenter" width="700"]
 Source: HUD/US Census Bureau[/caption]
While the recent rise in housing prices can cause some consumers to feel more affluent, it also means many are forced to rent rather than buy—contributing to rising rental costs. In May, consumer prices for rent of primary residences increased 5.2% from a year earlier, according to the BLS—the fastest pace since January 1987.
Implications
The strength of the housing market, especially house prices, had been a large benefit for retail. House moves contribute to furniture, furnishings, home-improvement and appliance sales and can trickle down further to discretionary sectors such as electronics. With new home purchases declining sharply year over year, sales growth has slowed down in related sectors. Furniture and home-furnishing retailers’ sales grew by only 2.3%, underpacing the 9.7% increase in furniture and home-furnishing prices in May, and sales of electronics and appliance stores declined 4.3%.
Source: HUD/US Census Bureau[/caption]
While the recent rise in housing prices can cause some consumers to feel more affluent, it also means many are forced to rent rather than buy—contributing to rising rental costs. In May, consumer prices for rent of primary residences increased 5.2% from a year earlier, according to the BLS—the fastest pace since January 1987.
Implications
The strength of the housing market, especially house prices, had been a large benefit for retail. House moves contribute to furniture, furnishings, home-improvement and appliance sales and can trickle down further to discretionary sectors such as electronics. With new home purchases declining sharply year over year, sales growth has slowed down in related sectors. Furniture and home-furnishing retailers’ sales grew by only 2.3%, underpacing the 9.7% increase in furniture and home-furnishing prices in May, and sales of electronics and appliance stores declined 4.3%.
What We Think
We expect retail sales growth to remain in the mid-single-digit territory through the summer and back-to-school season. As consumers battle inflationary pressures and interest rate hikes, we expect them to spend more on experiences while pulling back on goods spending. Implications for Brands/Retailers- The continuation of interest rate hikes, now steeper than initially planned by the Federal Reserve, is likely to reduce demand for goods in the long term. We believe consumers will spend strongly in the short term, until the back-to-school season.
- As we move into the back half of 2022, we should expect more modest sales growth. As consumers return home from their summer vacations and settle into the new school year, they will have to face the reality of historically low savings and pullback on spending.
- The Federal Reserve’s interest rate hike will dampen the wealth effect consumers felt through the pandemic, potentially resulting in a slight pullback in overall consumer spending after the summer season.