DIpil Das
The Coresight Research US Retail Traffic and In-Store Metrics series reviews changes in selected store-based metrics, as reported by RetailNext. In this month’s report, we review store traffic changes through June 2021—a month in which retail benefited from rising vaccination rates and the easing of pandemic-related restrictions in many states. This series usually reviews year-over-year changes in store-based metrics; however, all March, April, May and June data in this report are compared to 2019 as stores began closing in March 2020 due to Covid-19 and most stores were closed in April, May and June 2020.
RetailNext’s coverage does not include food retailers but does include some other retail sectors deemed essential; the exclusion of food retail means that the figures cited below almost certainly overstate recent declines in total retail traffic.
Figure 1. US Store-Based Nonfood Retail Metrics: YoY % Change [caption id="attachment_130112" align="aligncenter" width="725"]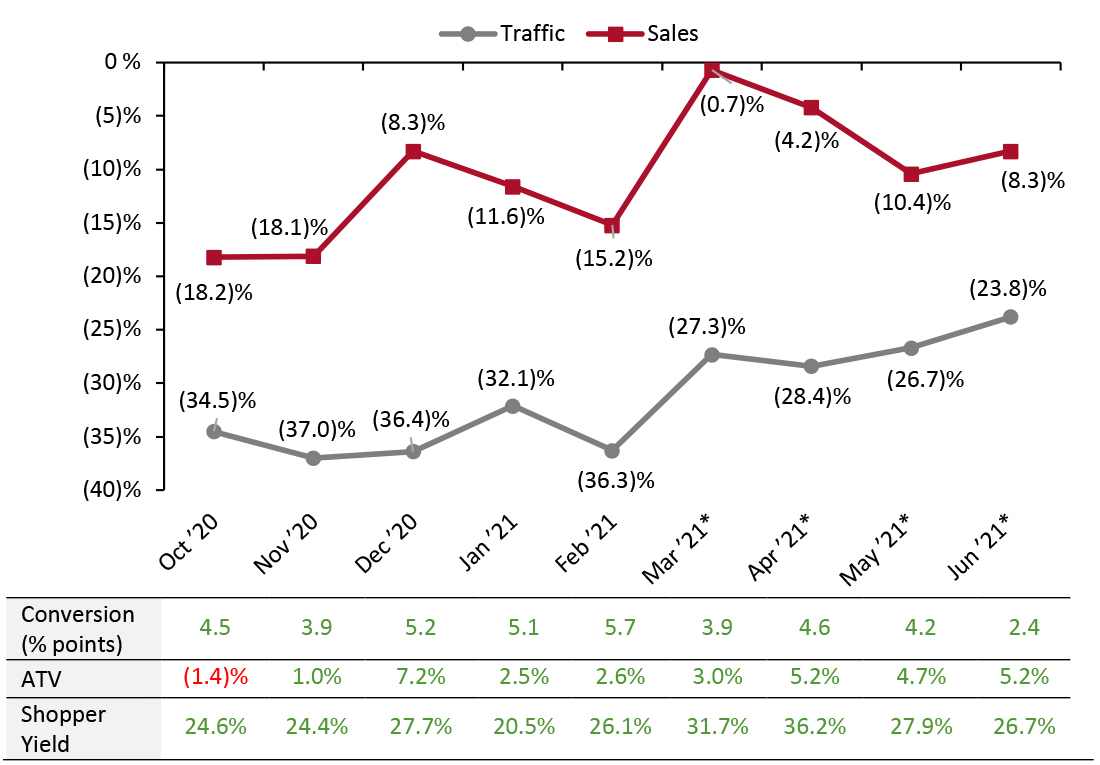 ATV=average transaction value; Shopper yield=Sales divided by traffic
*March, April, May and June 2021 numbers are compared to 2019 as stores began closing in March 2020 due to Covid-19 and most stores were closed in April, May and June 2020.
Source: RetailNext [/caption] Weekly Shopper Traffic Trends Weekly data for June tracks the progress of store traffic over five weeks (May 30–July 3, 2021):
Figure 2. US Retail Traffic by Industry Vertical: YoY % Change [caption id="attachment_130113" align="aligncenter" width="725"]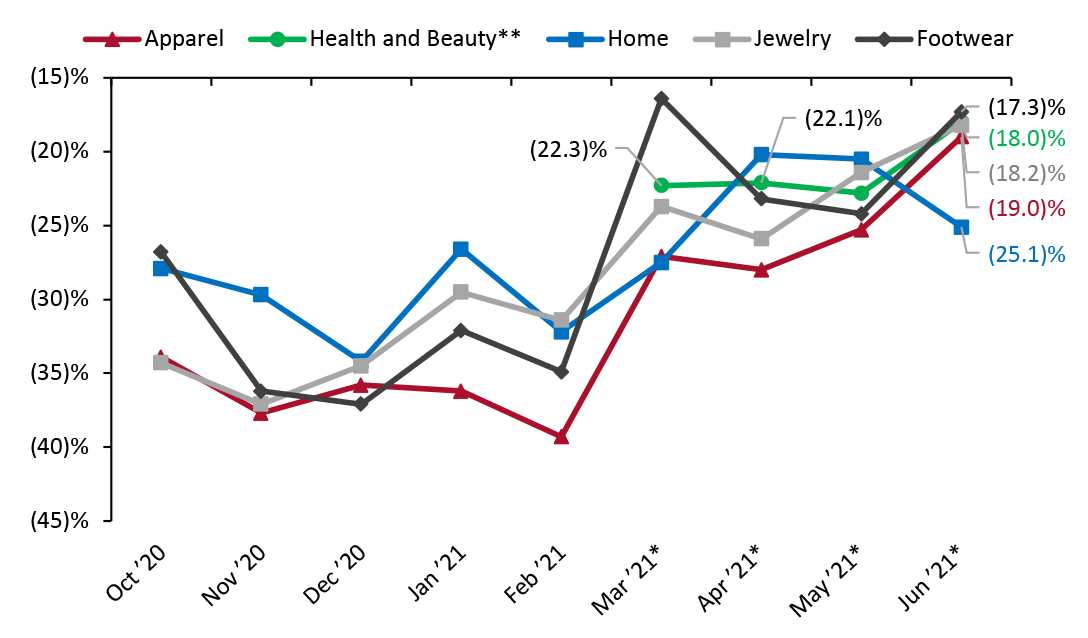 *March, April, May and June 2021 numbers are compared to 2019, as stores began closing in March 2020 due to Covid-19 and most stores were closed in April, May and June 2020.
**RetailNext started providing traffic trends for the health and beauty sector from March 2021.
Source: RetailNext [/caption] Regional Traffic Trends In June, new Covid-19 cases continued to slowly decline, but the highly contagious Delta variant became the most prevalent strain in the US. As vaccination rates increased, most states and territories, except Hawaii and Puerto Rico, fully reopened by the end of June—meaning mask mandates and pandemic restrictions were lifted, and businesses were permitted to resume to normal operations. Retail traffic in June varied across regions:
- June saw a strengthening in traffic trends: Traffic declined by 23.8% on a two-year basis in June, stronger than May’s 26.7% decline versus 2019.
- The sequential trend in store-based sales charted below broadly reflects the trend in retail sales overall, where two-year growth peaked at 27% in March as stimulus checks boosted spending. After slowing in each of April and May, two-year total retail sales growth strengthened to 24% in June, according to Census Bureau data published on July 16.
- The conversion rate (sales transactions as a percentage of traffic) grew 2.4 percentage points in June, versus May’s growth of 4.2 percentage points.
- In June, ATV (average transaction value, or sales divided by transactions) increased by 5.2%, higher than May’s 4.7% growth.
- Shopper yield (sales divided by traffic) increased by 26.7% in June,versus May’s 27.9% growth.
Figure 1. US Store-Based Nonfood Retail Metrics: YoY % Change [caption id="attachment_130112" align="aligncenter" width="725"]
ATV=average transaction value; Shopper yield=Sales divided by traffic *March, April, May and June 2021 numbers are compared to 2019 as stores began closing in March 2020 due to Covid-19 and most stores were closed in April, May and June 2020.
Source: RetailNext [/caption] Weekly Shopper Traffic Trends Weekly data for June tracks the progress of store traffic over five weeks (May 30–July 3, 2021):
- Traffic performed best in the first week of June, with declines of 18.9% on a two-year basis—a solid improvement from the final week of May, which saw a traffic decline of 26.5%. This improvement was mainly due to the Memorial Day weekend falling in the last week of May last year but the first week of June this year.
- Traffic declines accelerated substantially to 26.2% in the second week of June but eased to 19.3% in the third week. This was primarily due to the shift of the Father’s Day weekend from the second to the third week of June this year.
- Traffic declines accelerated to 24.6% in the fourth week of the month and increased to 27.9% in the fifth week, which saw the impact of the shift of the Independence Day weekend from the last week of June to the first week of July.
- The home sector reported the highest traffic decline of 25.1%, an increase of 460 basis points compared to May.
- The footwear sector posted the lowest traffic decline at 17.3%, an improvement of 690 basis points compared to May.
- The health and beauty sector was the second best-performing category, with a traffic decline of 18.0%, an improvement of 480 basis points compared to May.
- The jewelry sector saw a traffic decrease of 18.2%, an improvement of 320 basis points from May.
- The apparel sector posted a traffic decrease of 19.0%, an improvement of 630 basis points compared to May.
Figure 2. US Retail Traffic by Industry Vertical: YoY % Change [caption id="attachment_130113" align="aligncenter" width="725"]
*March, April, May and June 2021 numbers are compared to 2019, as stores began closing in March 2020 due to Covid-19 and most stores were closed in April, May and June 2020. **RetailNext started providing traffic trends for the health and beauty sector from March 2021.
Source: RetailNext [/caption] Regional Traffic Trends In June, new Covid-19 cases continued to slowly decline, but the highly contagious Delta variant became the most prevalent strain in the US. As vaccination rates increased, most states and territories, except Hawaii and Puerto Rico, fully reopened by the end of June—meaning mask mandates and pandemic restrictions were lifted, and businesses were permitted to resume to normal operations. Retail traffic in June varied across regions:
- The Midwest was the worst-performing region, witnessing a traffic decline of 26.0% as compared to 2019. The region saw its largest traffic declines in the second week before improving in the third week. In the fifth week, the Midwest’s traffic trends outperformed all other regions.
- The South posted the best traffic performance for the month, with a 19.2% decline compared to 2019. The region outperformed all other regions in the first four weeks of the month. In the fifth week, the South witnessed its largest decline, of 26.0%.
- The West posted a 22.5% traffic decline for the month. California reopened its economy on June 15, while Oregon and Washington lifted restrictions by the end of June. With more states lifting their restrictions, we expect to see an improvement in July’s traffic trends. In late June, the heatwave affecting Idaho, northern California, Oregon and Washington contributed to deteriorating traffic trends in the fourth and fifth weeks of the month.
- The Northeast posted an overall traffic decline of 25.7%, meaning that, for the first time since March 2021, it was not the weakest region. The region saw its largest traffic declines in the second week of the month.
- Traffic by mall location type declined between 11.5% and 28.2%—strip malls outperformed all other location types, with a decline of only 11.5%. These locations benefited from being open-air and from the presence of nondiscretionary retailers, such as food retailers.
- Traditional malls were the second-best performing location, with a traffic decline of 19.8%.
- Street-front/freestanding locations witnessed the largest traffic decline, of 28.2%, while outlet locations reported the second-largest traffic decline, of 25.0%.
- Lifestyle centers and luxury locations outperformed the national average, with declines of 23.5% and 23.2% respectively.
- Other retail locations, including airports, casinos and hotels, reported a traffic decline of 23.8%--an improvement from May’s 31.5% decline. Many of these locations are situated in destination areas and likely witnessed an improvement in foot traffic in tourist locations with more consumers visiting due to the easing of travel restrictions and the decline in new Covid-19 cases.