
Nitheesh NH
US Retail Sales: June 2021
Coresight Research’s measure of core retail sales is the unadjusted year-over-year change, excluding gasoline and automobiles. This metric slowed to a still-strong 12.3% in June, from 16.7% in May, as reported by the US Census Bureau on July 16, 2021. This dip in year-over-year growth was expected: May sales growth was much stronger, largely due to weak comparatives in 2020. In June 2020, we saw high single-digit year-over-year growth, as lockdowns eased and businesses resumed operations, acting as a moderating effect on June 2021 growth. Overall, in June 2021, the demand for goods remained solid even as consumer spending is shifting back to services. Furthermore, we saw a strengthening in traffic trends in June, driven by rising vaccination rates and the easing of pandemic-related restrictions in many states.Figure 1. US Total Retail Sales ex. Gasoline and Automobiles: YoY % Change [caption id="attachment_130221" align="aligncenter" width="700"]
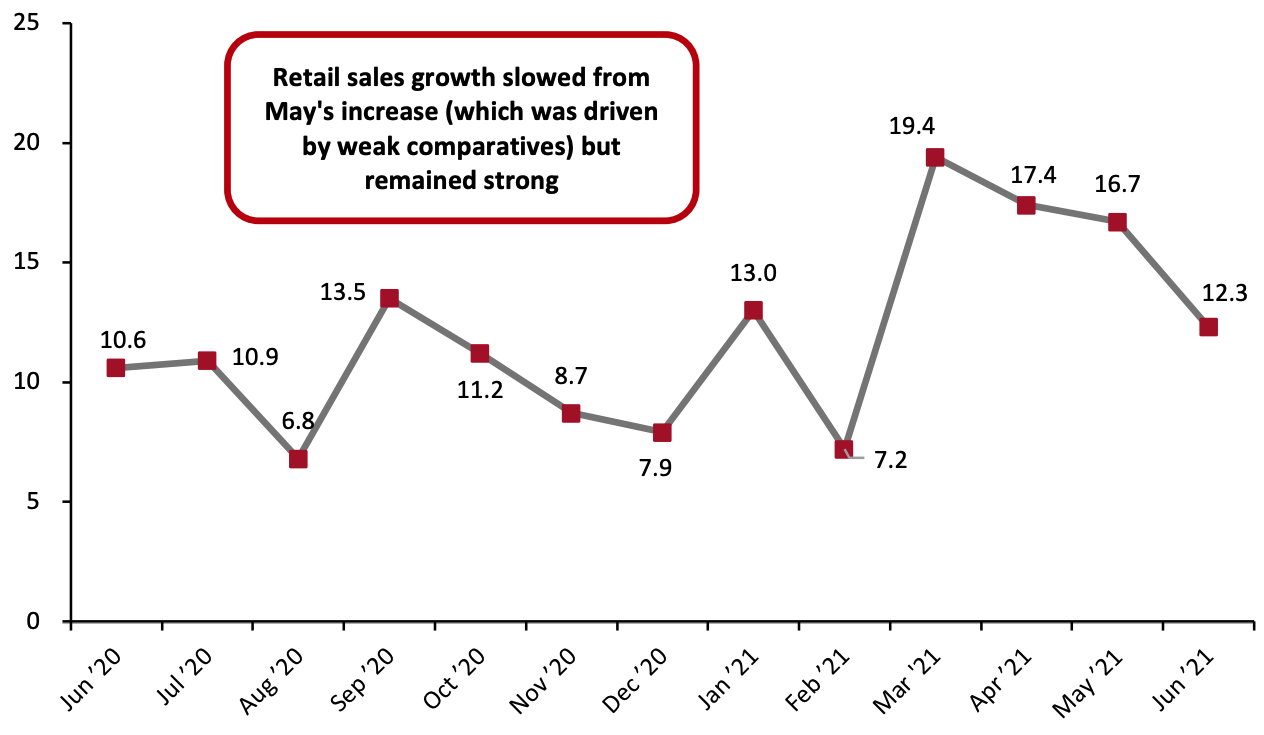 Data are not seasonally adjusted
Source: US Census Bureau/Coresight Research[/caption] In relation to the more consistent comparatives of 2019, June retail sales were higher than May’s. June sales grew 24.2% from 2019 values, up 5.3 percentage points from May’s growth. On a two-year basis, this was the second strongest growth (along with April’s growth) in sales of any month in the past year.
Figure 2. US Total Retail Sales ex. Gasoline and Automobiles: % Change from Two Years Prior [caption id="attachment_130222" align="aligncenter" width="700"]
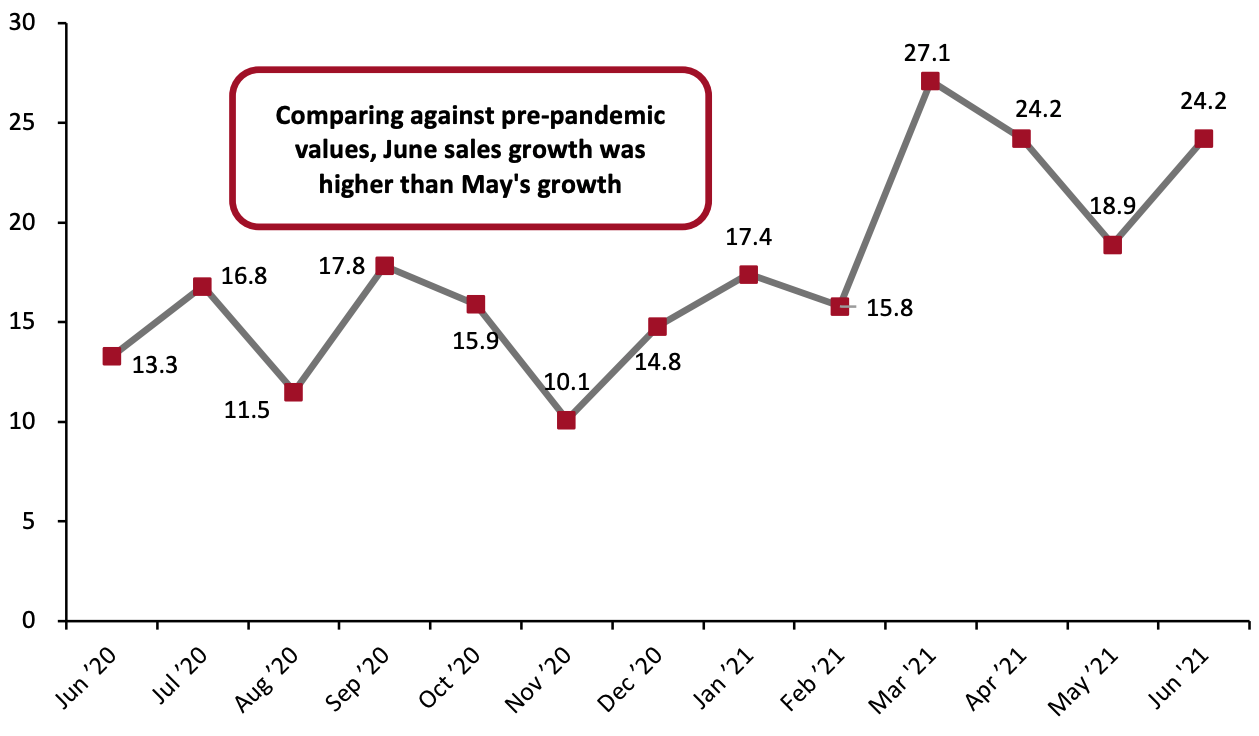 Source: US Census Bureau/Coresight Research[/caption]
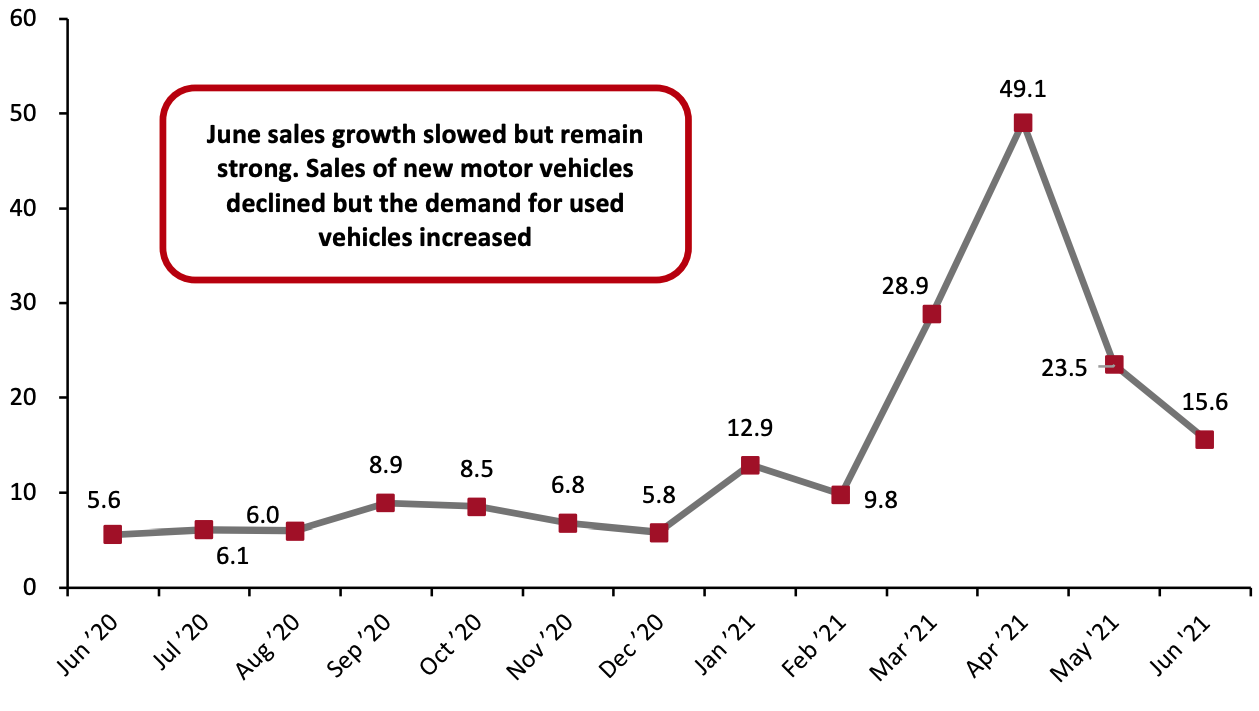
Seasonally adjusted retail sales, including automobiles and gasoline, grew 15.6% year over year, versus May’s 23.5% growth. In June, the sales of new motor vehicles declined due to a lack of supply caused by a global semiconductor scarcity. However, the dearth of new motor vehicles boosted demand for used cars and trucks, fueling inflation. Automobile manufacturers are still facing shortages of microchips, which could cause difficulties in producing enough supply to meet continued high demand, potentially further pushing up the cost of used cars.
Source: US Census Bureau/Coresight Research[/caption]
Seasonally adjusted retail sales, including automobiles and gasoline, grew 15.6% year over year, versus May’s 23.5% growth. In June, the sales of new motor vehicles declined due to a lack of supply caused by a global semiconductor scarcity. However, the dearth of new motor vehicles boosted demand for used cars and trucks, fueling inflation. Automobile manufacturers are still facing shortages of microchips, which could cause difficulties in producing enough supply to meet continued high demand, potentially further pushing up the cost of used cars.
Figure 3. US Total Retail Sales incl. Gasoline and Automobiles: Seasonally Adjusted YoY % Change [caption id="attachment_130223" align="aligncenter" width="700"]
 Data are seasonally adjusted
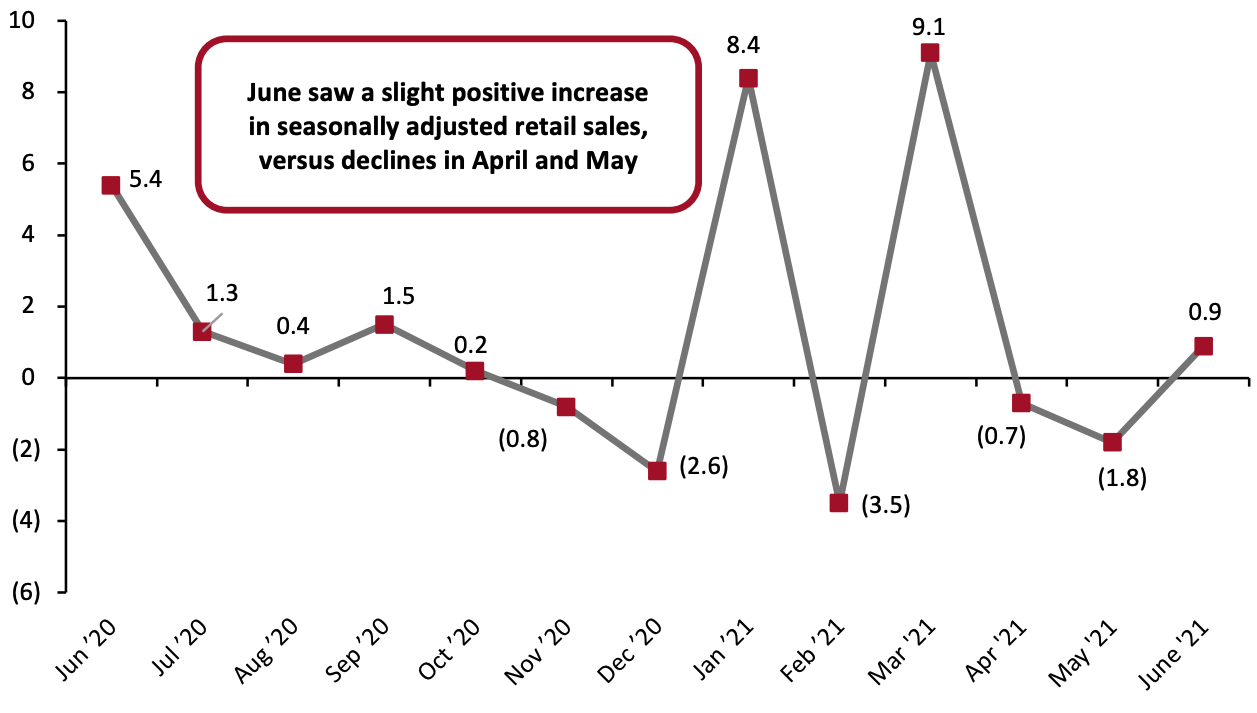
Source: US Census Bureau/Coresight Research[/caption] Sales Increase Marginally, Month over Month On a month-over-month basis, seasonally adjusted sales (excluding automobiles and gas) increased by 0.9% in June, versus declines in April and May. So far in 2021, the overall sales trend remains largely positive. Earlier in January and March, we saw sharp spikes in sales that have kept seasonally adjusted sales well above their level in the holiday season.
Figure 4. US Total Retail Sales ex. Gasoline and Automobiles: MoM % Change [caption id="attachment_130224" align="aligncenter" width="700"]
 Data are seasonally adjusted
Source: US Census Bureau/Coresight Research[/caption] Retail Sales Growth by Sector Although overall retail sales saw high single-digit sales growth in June 2020, Covid-19’s spread through the US last spring hit some sectors much harder than others. To control for the effects of the pandemic in 2020’s retail sales figures, we largely compare June 2021 sales to pre-pandemic June 2019 sales in this section. In a very strong month, seven sectors saw sales growth of 15% or more from 2019 levels:
- Nonstore retailers continued to thrive in June, with sales growing 45.0% from 2019 values. Perhaps even more impressively, this sector saw sales growth of 12.0% from 2020, when lockdowns kept consumers indoors and pushed sales online. Continued surges in this sector, even as stores across the country are now open without restrictions, suggest that there will not be a post-pandemic e-commerce retrenchment.
- Sporting goods and hobby store sales rose 39.7% from 2019 values. Compared to 2020 values, the sector saw growth of 11.0% year over year.
- Home-improvement retailers saw growth of 34.4% from pre-pandemic values, keeping sales at the heightened levels we have seen for the past year.
- Furniture and home-furnishings stores, which unlike home-improvement retailers did not perform nearly as well in the immediate aftermath of Covid-19, continued with recent strong performance, recording growth of 20.4% in June 2021 compared to June 2019. This is higher than 17.8% growth in May on a two-year basis.
- Miscellaneous store retailers saw solid sales growth of 28.9% from 2019, a strong acceleration from May’s 16.6% growth from 2019 levels.
- Health and personal care store sales grew 16.1% from 2019 values, more than double May’s growth of 7.7% from 2019.
- Food and beverage stores continued to see elevated sales, rising 15.5% from 2019 levels and 3.7% from 2020 levels. Grocery stores saw 14.4% growth from 2019 and 3.3% growth from 2020. While these growth numbers from 2020 are far lower than in most other categories, they represent strong performance from the grocery industry following very demanding 2020 comparatives, which have caused major grocers to project sales declines in 2021 in the low single digits.
- Clothing and clothing accessories stores saw sales growth slow to a still-strong 9.8% from 2019 levels, versus May’s 17.9% growth from 2019.
- Electronics and appliance stores saw solid growth in June, with sales rising 9.6% from 2019 values, a substantial acceleration from May’s 3.6% growth. Although consumers have spent well on electronics throughout the crisis, for much of 2020 they directed their spending away from specialty electronics retailers to online-focused channels. The sector appears to be drawing back more consumers but may soon begin to feel tangible impacts of a growing scarcity of microchips used in electronics and appliances that has already hit the auto industry.
- While general merchandise stores saw sales growth of 13.6% from 2019, in-line with May’s growth, department stores sales growth turned positive in June based on 2019 levels at 6.6%, versus a 0.1% decline in May on a two-year basis.
Figure 5. US Total Retail Sales, by Sector: YoY % Change from 2020 (Top) and 2019 (Bottom)
| 2020 | May | June |
| Total retail sales (ex. automobiles and gasoline) | 16.7 | 12.3 |
| Furniture and home-furnishing stores | 65.1 | 17.5 |
| Electronics and appliance stores | 86.4 | 36.5 |
| Building material and garden supply retailers | 10.7 | 7.0 |
| Food and beverage stores | (0.2) | 3.7 |
| - Grocery stores | (0.7) | 3.3 |
| Health and personal care stores | 21.0 | 13.5 |
| Clothing and clothing accessory stores | 198.4 | 49.4 |
| Sporting goods, hobby, musical instrument and book stores | 40.3 | 11.0 |
| General merchandise stores | 9.2 | 10.7 |
| - Department stores | 28.4 | 24.6 |
| Miscellaneous store retailers | 46.7 | 24.9 |
| Nonstore retailers | 6.9 | 12.0 |
| Motor vehicle and parts dealers | 33.0 | 20.4 |
| Gasoline stations | 54.5 | 37.4 |
| 2019 | May | June |
| Total retail sales (ex. automobiles and gasoline) | 18.9 | 24.2 |
| Furniture and home-furnishing stores | 17.8 | 20.4 |
| Electronics and appliance stores | 3.6 | 9.6 |
| Building material and garden supply retailers | 26.2 | 34.4 |
| Food and beverage stores | 14.7 | 15.5 |
| - Grocery stores | 13.9 | 14.4 |
| Health and personal care stores | 7.7 | 16.1 |
| Clothing and clothing accessory stores | 17.9 | 9.8 |
| Sporting goods, hobby, musical instrument and book stores | 36.7 | 39.7 |
| General merchandise stores | 13.6 | 13.6 |
| - Department stores | (0.1) | 6.3 |
| Miscellaneous store retailers | 16.6 | 28.9 |
| Nonstore retailers | 32.0 | 45.0 |
| Motor vehicle and parts dealers | 27.7 | 31.4 |
| Gasoline stations | 4.5 | 11.2 |
Data are not seasonally adjusted Source: US Census Bureau/Coresight Research