albert Chan
What’s the Story?
In our Leading Indicators of US Retail Sales monthly series, we examine several key macroeconomic indicators of US retail sales and analyze how they may impact the industry in the months to come. We analyze the latest available data, as of the end of June 2021, from sources such as the US Census Bureau, the US Bureau of Economic Analysts (BEA), the US Bureau of Labor Statistics (BLS) and the US Department of Housing and Urban Development (HUD).
Why It Matters
Macroeconomic indicators have a significant impact on overall retail sales growth. Looking at 10 indicators (unemployment rate, labor force participation rate, disposable income per capita, average hourly wages, consumer sentiment, savings rate, gas price, federal funds rate, housing starts and housing prices), we can historically account for a majority of the variation in retail sales growth and create a strong basis for predicting sales moving forward.
The close correlation between retail sales growth predictions based on economic indicators and actual retail sales growth is shown in Figure 1.
Figure 1. US Actual Retail Sales ex. Auto and Gas Sales vs. Model Predicted Sales, January 2000–January 2021 (YoY % Change)
[caption id="attachment_129983" align="aligncenter" width="700"]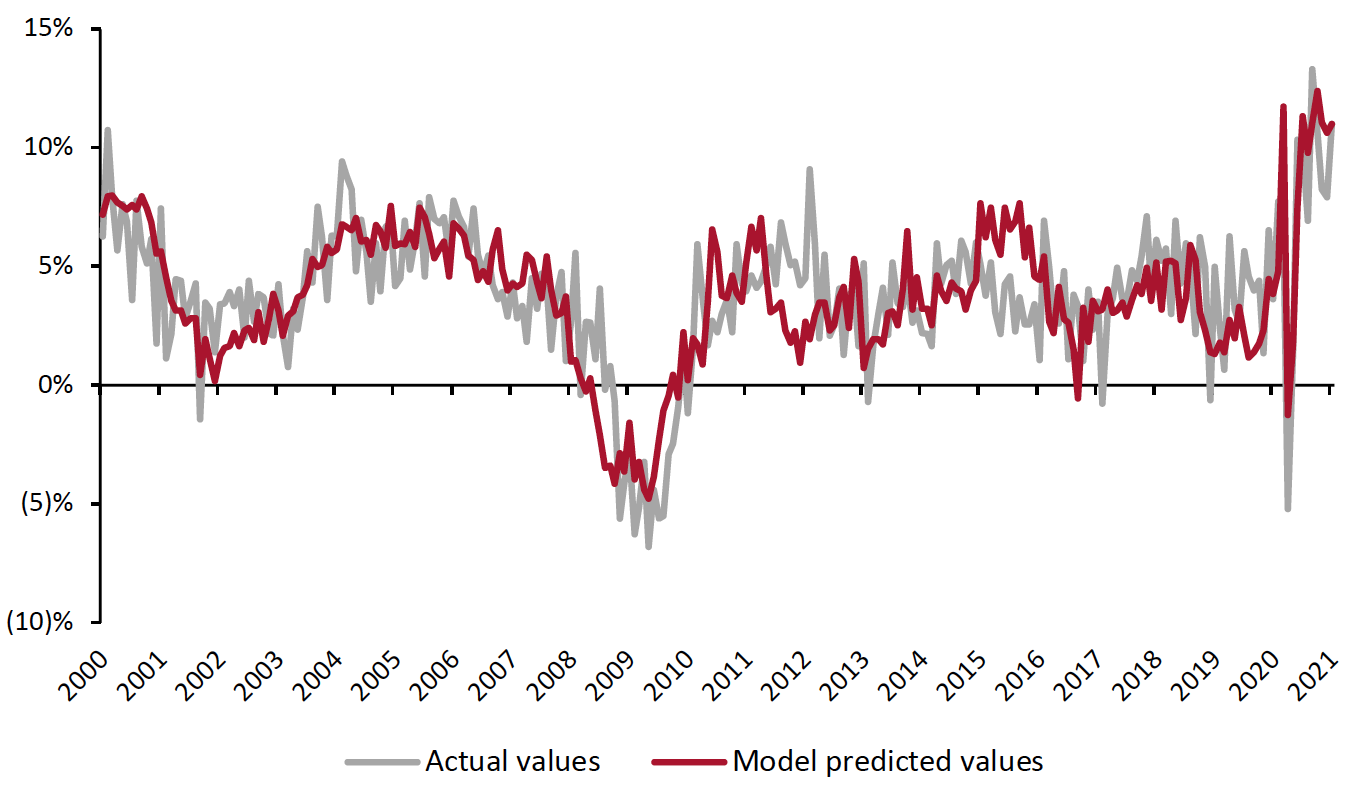 Source: BEA/BLS/Federal Reserve Board of Governors/S&P/Coresight Research[/caption]
In May, retail sales saw slower growth than April’s spectacular increase—yet still faster than the start of the year and the year-ago period. The effects of the latest stimulus program wearing off as the checks are spent, combined with a minor decrease in consumer confidence may be the cause. Going forward, retail consumption remains optimistic, as many indicators examined point toward continuing, if at times halting, growth.
Leading Indicators of US Retail Sales: In Detail
Indicators Overview
Of the 10 indicators we examined, six are likely to have a positive impact on retail sales in the coming months. June’s job report continues to show improvement relative to May, albeit at a reduced rate, as the economy continues to improve. The overall labor force participation rate remains essentially unchanged. Provided the labor force participation rate remains static, the downward trend in the unemployment rate could herald a more competitive labor market in the coming months and an associated increase in wages.
Figure 2. US: Leading Indicators of Retail Sales, as of the End of June 2021 [caption id="attachment_129984" align="aligncenter" width="700"]
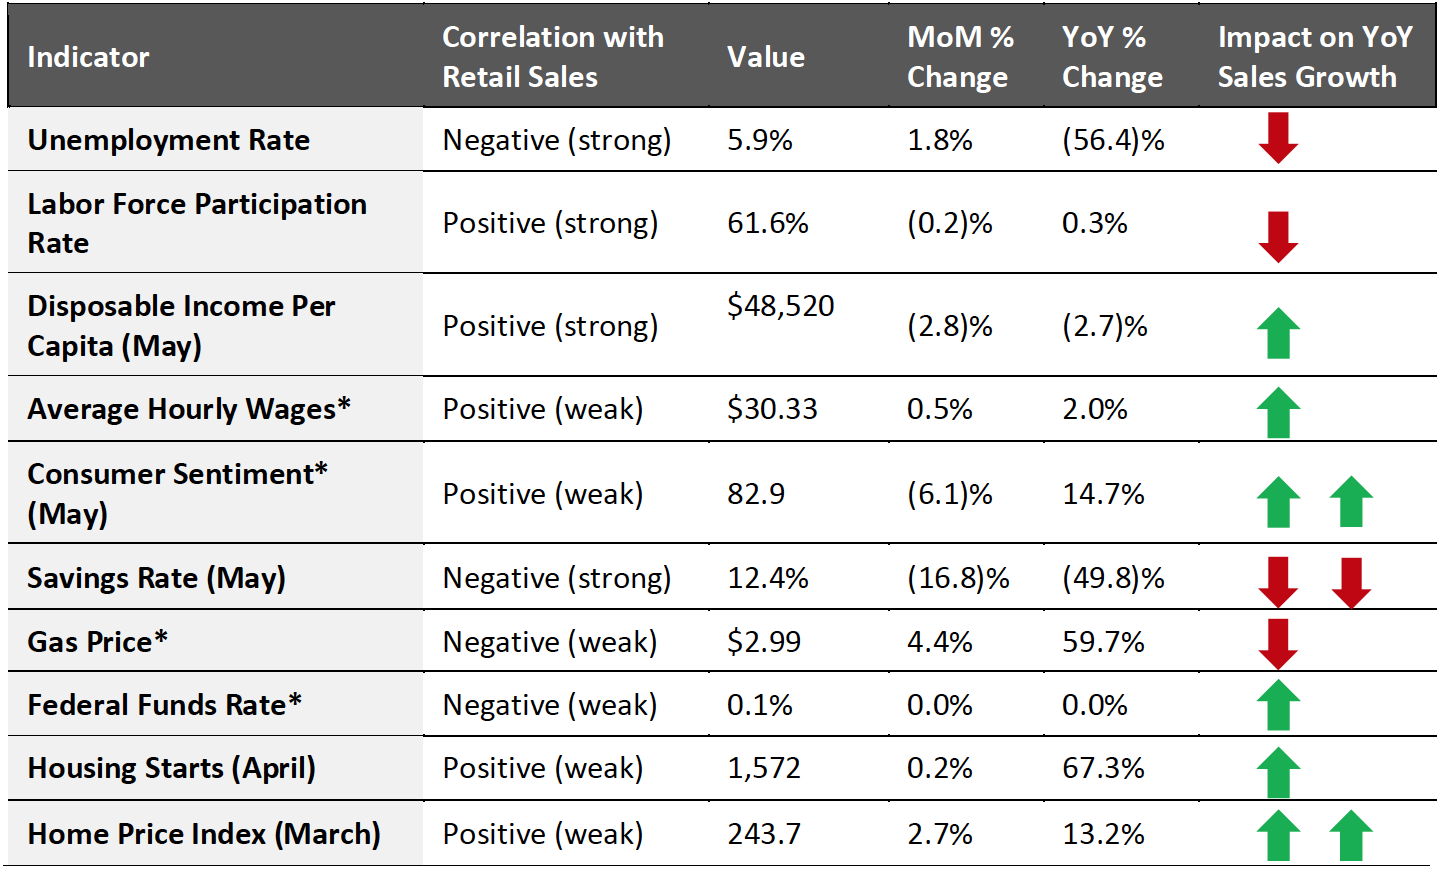 Latest available data from June unless otherwise indicated
*Not included in predictive model
Source: BEA/BLS/Federal Reserve Board of Governors/S&P/University of Michigan/US Energy Information Administration/Coresight Research[/caption]
Looking ahead to soon-to-be-reported June retail sales (at the time of publication) and projected sales in July, we expect retail sales to increase by 10.3% year over year, as illustrated in Figure 3. This is roughly two thirds of March’s 17.3% growth and far below April’s 28.5% increase, which this inflated by weak 2020 comparatives.
Figure 3. US Retail Sales ex. Auto and Gas (YoY % Change)
[caption id="attachment_129985" align="aligncenter" width="700"]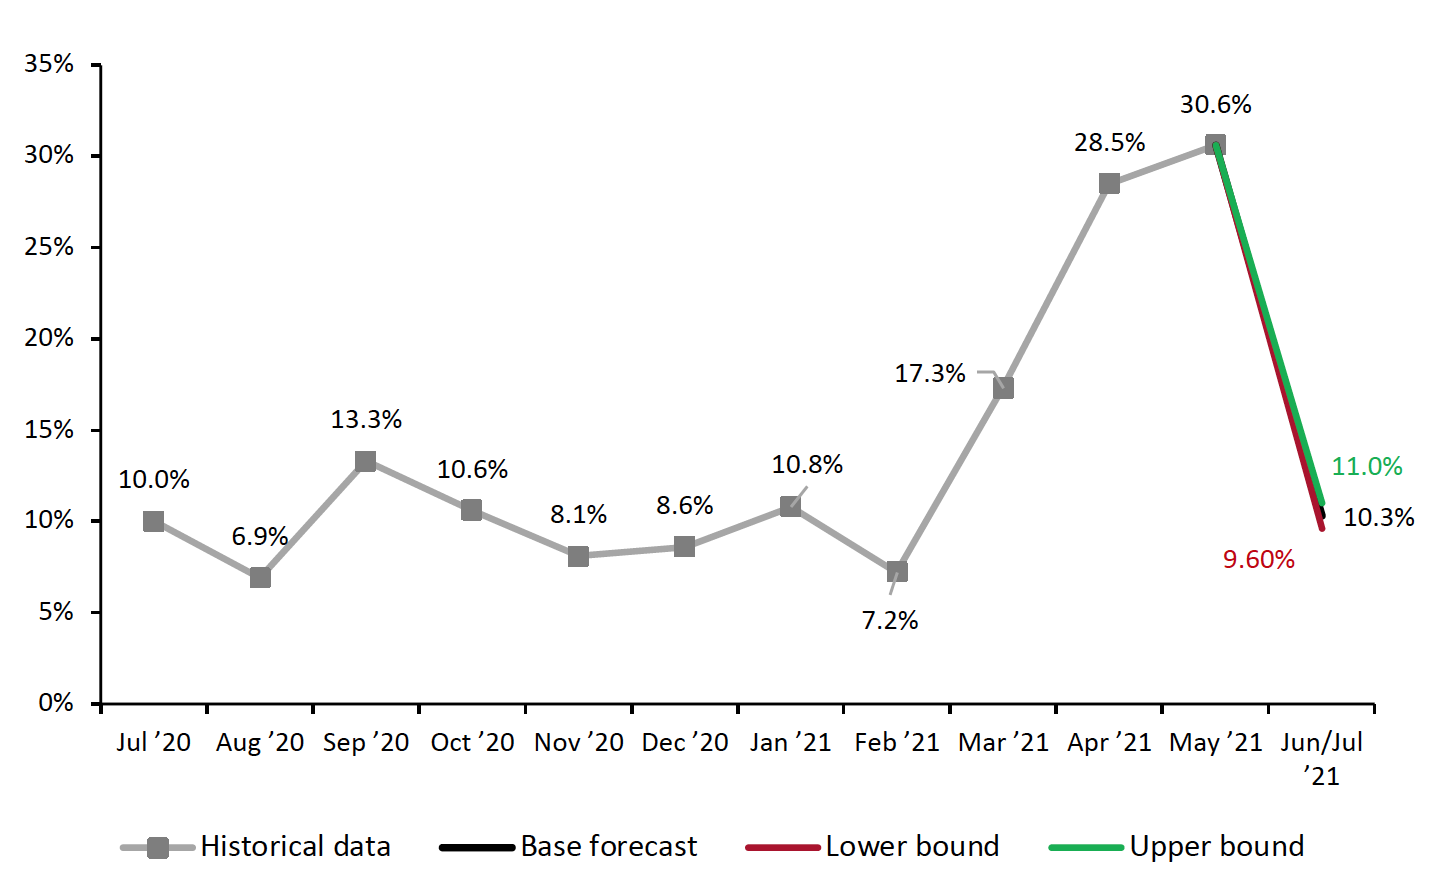 Source: BEA/BLS/Federal Reserve Board of Governors/S&P/Coresight Research[/caption]
The Job Market
The narrative around the job market has flipped in recent months, with businesses still struggling to fill vacancies. Generous federal unemployment benefits (which some states have begun to reject), high levels of savings, health concerns and care obligations have contributed to this labor shortage.
In June, there was a minor setback in unemployment rate as it grew from 5.8% to 5.9%. Nonetheless, it is still the second lowest it has been since April 2020, which saw an extremely high unemployment rate of 14.8%. The labor force participation rate remains the same as last month, at 61.6%. In the near future, the labor force participation rate may be a more important indicator than the unemployment rate—recovery in the labor market now hinges on drawing workers back to jobs rather than on job creation.
Figure 4. US Unemployment Rate (Left Axis, %) and Labor Force Participation Rate (Right Axis, %)
[caption id="attachment_129986" align="aligncenter" width="700"]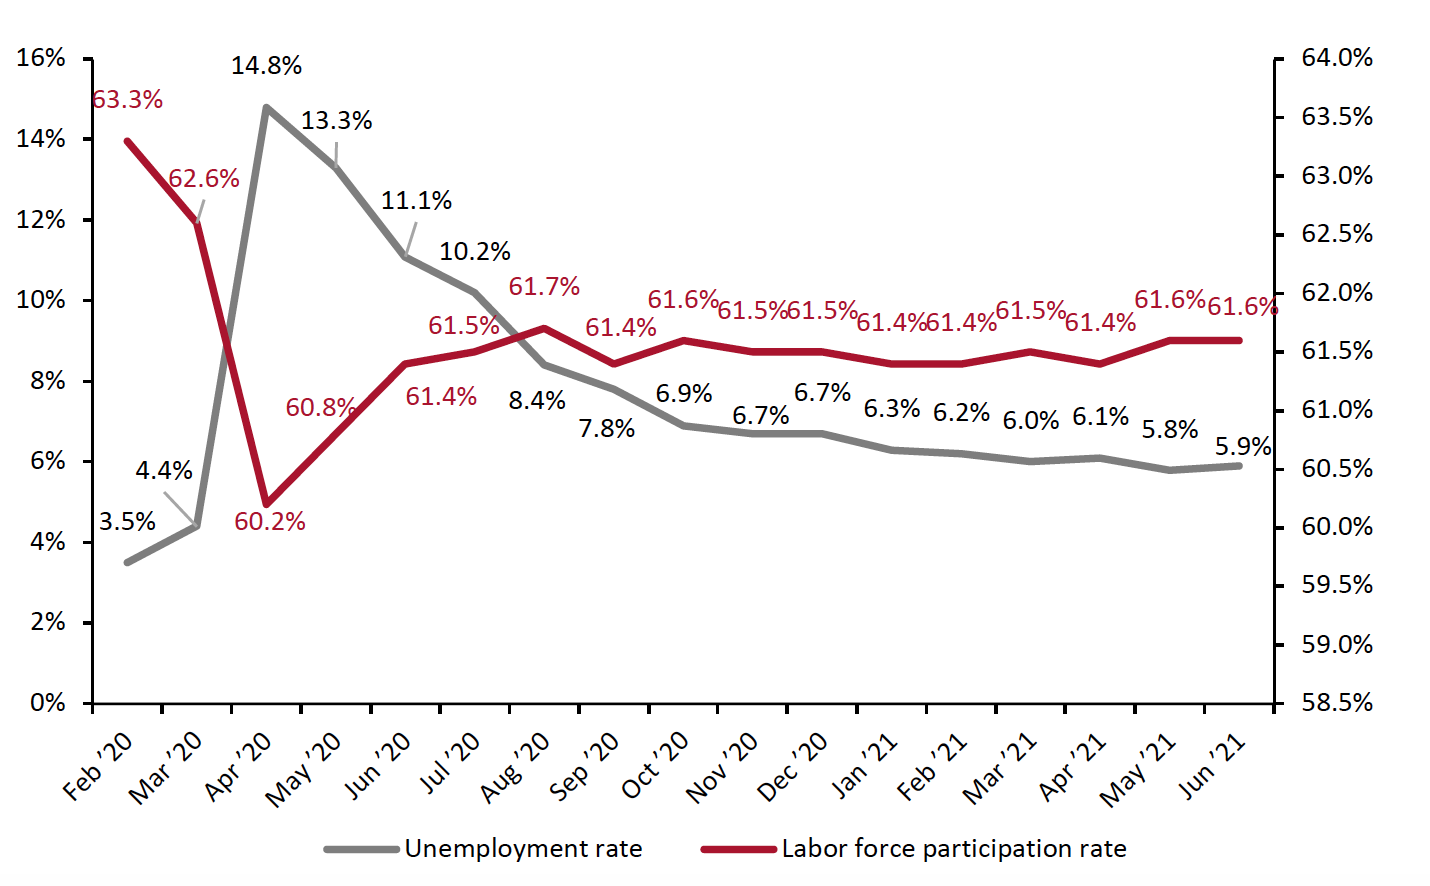 Source: BLS[/caption]
The highs in average hourly wages in the private sector continued in June, with May’s previous record of $30.3 surpassed by a record $30.4. This is the third consecutive month of record-breaking average wages. Considering the sheer scale of the US economy and the (somewhat diminished) labor force, even the comparatively small change of $0.1 ought to be considered noteworthy.
Figure 5. US Average Hourly Wages, All Private-Sector Employees (USD)
[caption id="attachment_131320" align="aligncenter" width="726"]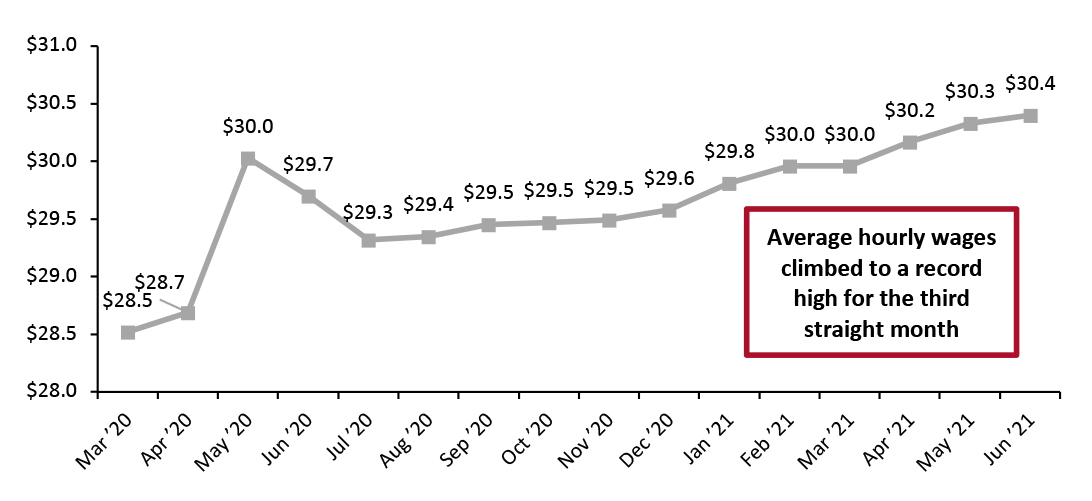 Source: BLS[/caption]
Implications
Labor market recovery continues to build on the progress in May, although concerns that growth will be hamstrung by worker shortages remain. The bottom line for retailers: Low employment numbers are now, in part, by the choice of the consumer and are likely not having such a negative impact on consumer spending as they were for most of the pandemic. However, as unemployment benefits expire and consumers use up savings accumulated during the pandemic, many more are likely to seek employment. This will cause a rise in the labor force participation rate and thus may alleviate some labor shortage concerns.
Income, Savings and Sentiment
Following the expected stimulus-driven spike in March, real disposable income per capita fell substantially in April, to $49,894. It continued to fall in May to $48,520, nearly the exact same level it was one year ago. However, this level remains greater than February’s $47,374, the first month of 2021 without a stimulus check.
Figure 6. US Annualized Real Disposable Income Per Capita (USD)
[caption id="attachment_129988" align="aligncenter" width="700"]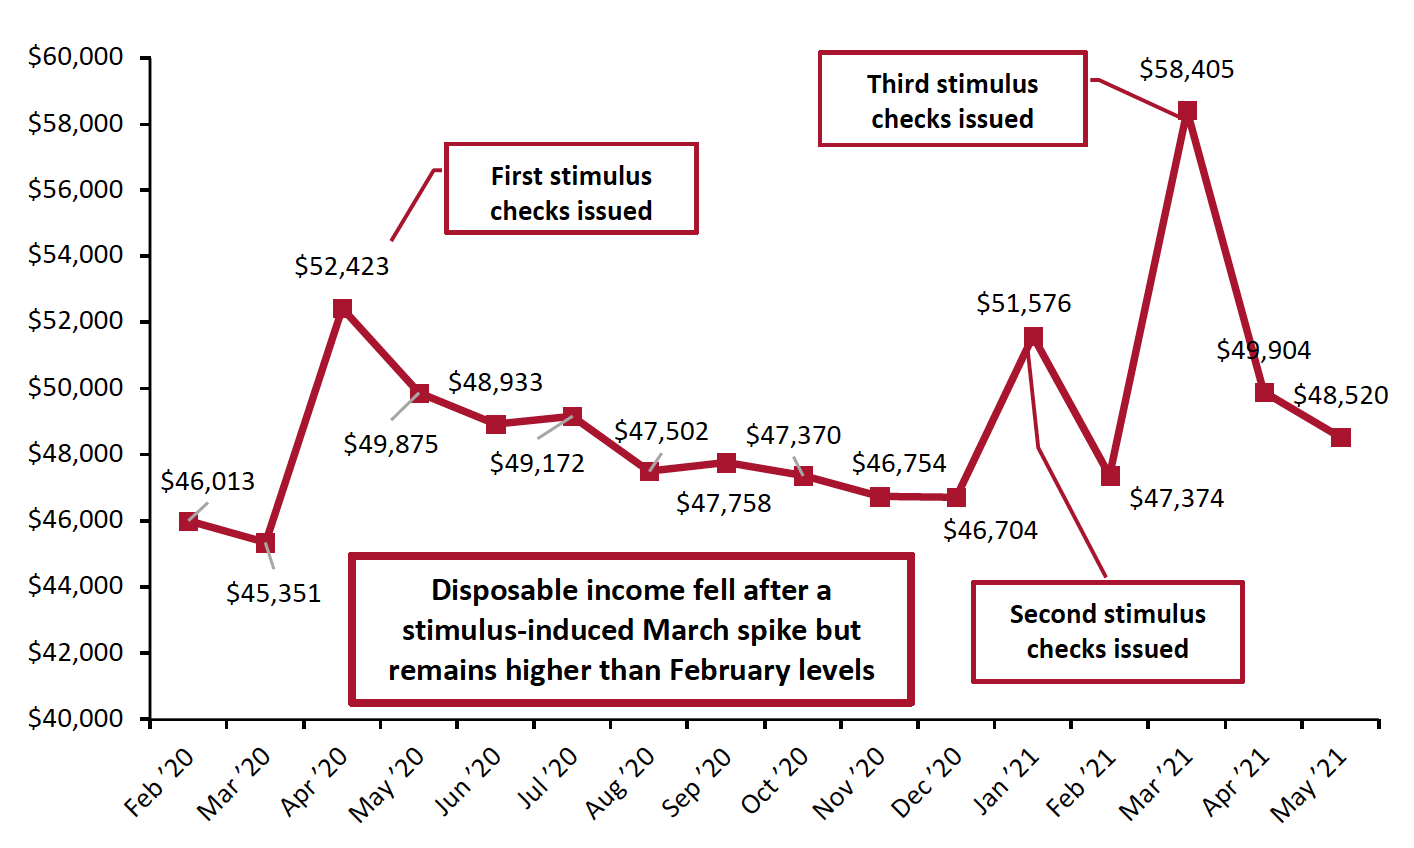 Source: BEA[/caption]
With every round of stimulus checks, the personal savings rate and real disposable income per capita have risen and then dropped the following month. The same pattern held in May, with the savings rate falling to 12.4%—fractionally below March 2020 levels, when the first pandemic restrictions in the US began, which could indicate that spending and saving habits are beginning to return to pre-pandemic patterns.
The savings rate likely declined relative to April due to a combination of changing spending habits from pandemic recovery and stimulus payments drying up. The latter is consistent with our predictions in last month’s report.
Figure 7. Personal Savings Rate (%)
[caption id="attachment_129989" align="aligncenter" width="700"]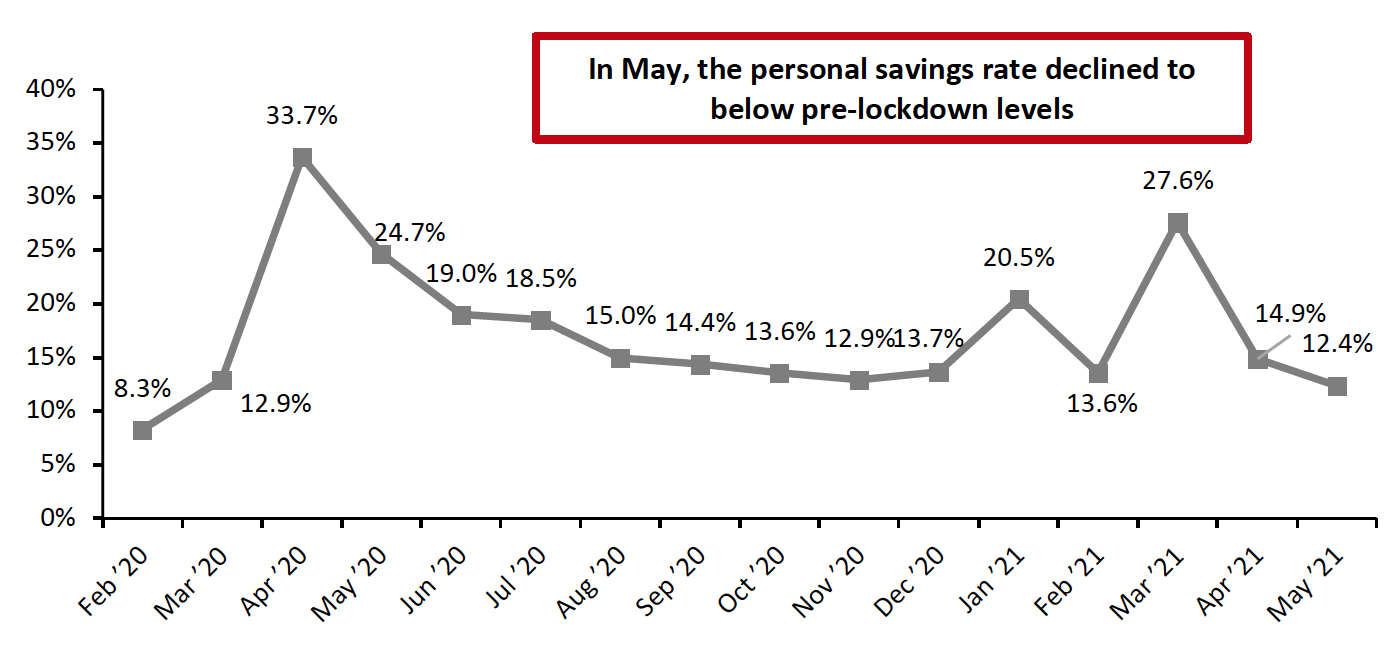 Source: BEA[/caption]
Consumer confidence fell in May, breaking the turnaround seen in March and April. This is largely due to the waning impact of stimulus checks—consumer confidence remains 6.1 percentage points above February 2021 and 10.6 percentage points above the year-ago period. Therefore, we anticipate that this will fall will be a minor setback.
Nevertheless, new consumer concerns may be on the horizon: Inflation fears have more merit as wages and prices continue to rise. Covid-19 continues to mutate, with recently identified “Delta” and “Lambda” variants obtaining significant media coverage—leading to questions regarding vaccines and again raising the specter of lockdowns and quarantines. With labor availability and supply issues, there are currently a variety of concerns for consumers.
Figure 8. University of Michigan Consumer Sentiment Index [caption id="attachment_129990" align="aligncenter" width="700"]
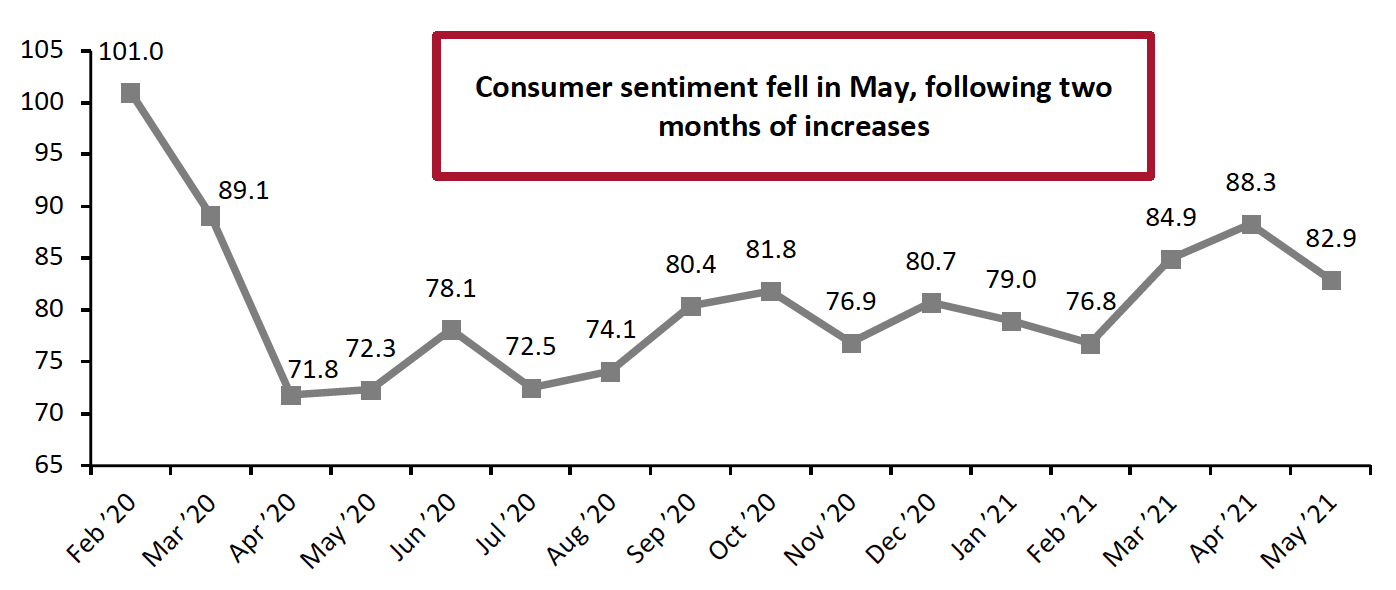 Source: University of Michigan[/caption]
Gas prices continue to rise dramatically, stoking inflation concerns. Gas prices have now risen for seven consecutive months, to $3.07 as of the end of June—a 45.9% rise since the uptick in gas prices began in November 2020 (an increase of $0.96 per gallon) and 2.79% higher than in May 2021 (an increase of $0.08 per gallon).
Figure 9. US Regular All Formulations Gas Price (Dollars per Gallon)
[caption id="attachment_129991" align="aligncenter" width="700"]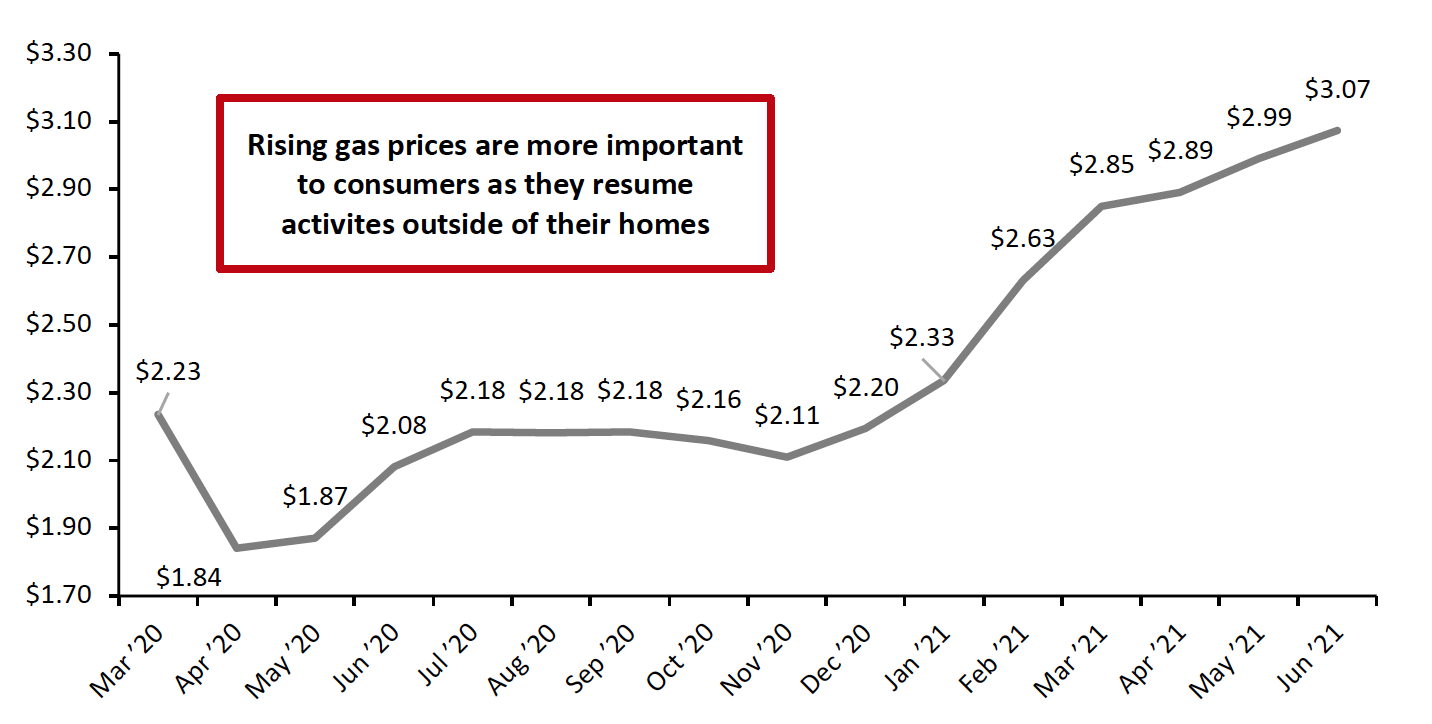 Source: US Energy Information Administration[/caption]
With consumers getting out and about more than any other time since the start of the pandemic, rising gas prices will have an exaggerated impact on their ability to spend on other products.
Implications
As the savings rate returned to pre-pandemic levels, we expect consumers to spend more freely in the coming months. Despite this month’s minor setback due to the waning effect of stimulus programs, consumer sentiment is likely to rise again, reverting to the general upward trend seen in the previous months. We expect the concerns surrounding Covid-19 variants to be offset by the easing of pandemic restrictions and the success of vaccination programs. Consumers are returning to travel, restaurants and other service spending as virus fears fade. A rise in gas prices will put a slight dampener on spending, especially if last summer’s trend of more consumers traveling by car recurs this year. Gasoline consumption has low price elasticity, making it unlikely that the rise in gas price will significantly curtail driving—it will instead likely come out of consumers spending budget, acting as a minor headwind to retail sales.
Housing
After a strong March, housing starts fell in April to closer to February 2021 values and remained flat in May.
Home prices rose to high in March, a record that was surpassed in April (the latest month for which Case-Shiller Index data is available). The Case-Shiller Index rose 5.4 points to 249.2 in April, the second largest single-month increase since the outbreak of the pandemic. These rising prices may slow starts moving forward.
Figure 10. Housing Starts (Thousands, Left Axis) and Case-Shiller US Home Price Index (Right Axis) [caption id="attachment_129992" align="aligncenter" width="700"]
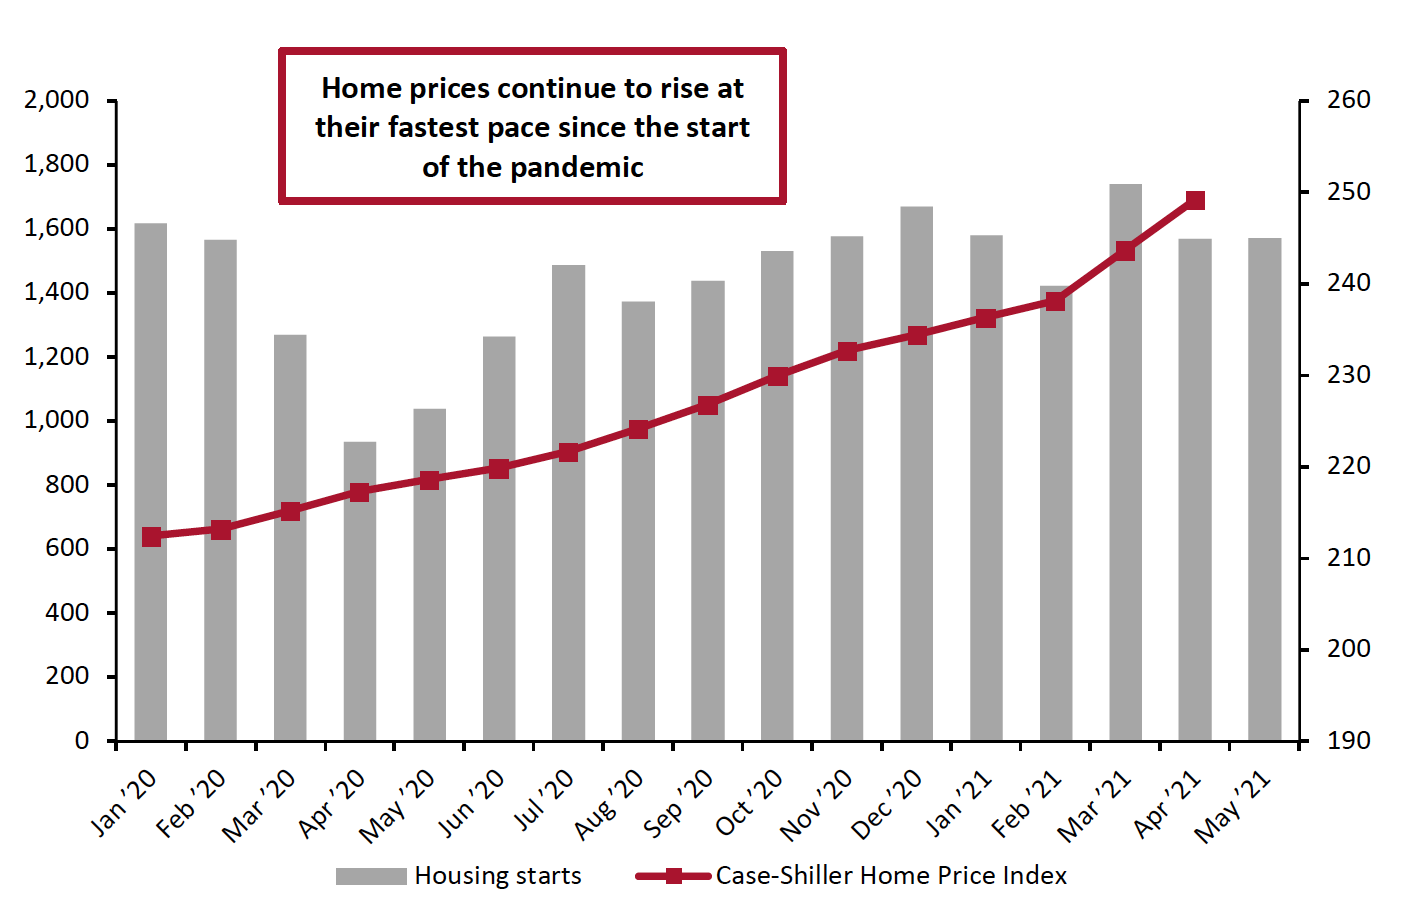 Source: HUD/US Census Bureau[/caption]
The housing market continues to face two dueling forces: Prolonged low interest rates have made home financing, and thus ownership, more attractive—while prices have simultaneously been driven up to levels that many consumers cannot afford. It may not be immediate, but housing starts may begin to decline as high prices squash demand unless prices are reduced.
Implications
We commented in the two previous iterations of this report that home prices have been rising at an accelerating pace. That trend continues to persist, slowing only slightly. Rising home prices may cause consumers to feel wealthier and are likely boost spending by homeowning consumers, reducing the feeling of the necessity to save stemming from rising equity. However, the home-buying rush is likely to slow soon, as the price adjustment created by the surge in demand makes prices prohibitively high for many to purchase homes despite low interest rates.
What We Think
May retail sales were very strong and increasing numbers of wealthy and employed consumers look set to keep that strong spending going through the summer.
Implications for Brands/Retailers
- The potential for a labor price correction could be a mixed blessing for retailers. If the labor market continues to tighten, increased competition for labor will necessitate an increase in wages, and subsequently depress margins. Conversely, higher wages combined with increased home equity will lead to increased discretionary spending, provided that consumer confidence continues to improve. The impact of the third round of stimulus payments appears to have run its course, and retailers should be cautious of using the March–April period in their forecasts.
- If the housing market continues to slow, we can expect demand for housing-related products to be similarly impacted. If housing values begin to noticeably drop, the resulting decrease in consumer spending as a result of the wealth effect could undo some of the progress of the last few months.