DIpil Das
The Coresight Research US Retail Traffic and In-Store Metrics report reviews year-over-year changes in selected store-based metrics as reported by RetailNext. In this month’s report, we review store traffic changes through June, when nonessential businesses continued to reopen in some states but reopenings were reversed in others. RetailNext’s coverage does not include food retailers but does include some other retail sectors deemed essential; the exclusion of food retail means that the figures cited below almost certainly overstate recent declines in total retail traffic.
Weekly Shopper Traffic Trends
Weekly data for June tracks the progress of store reopenings over five weeks (May 31–July 4, 2020):
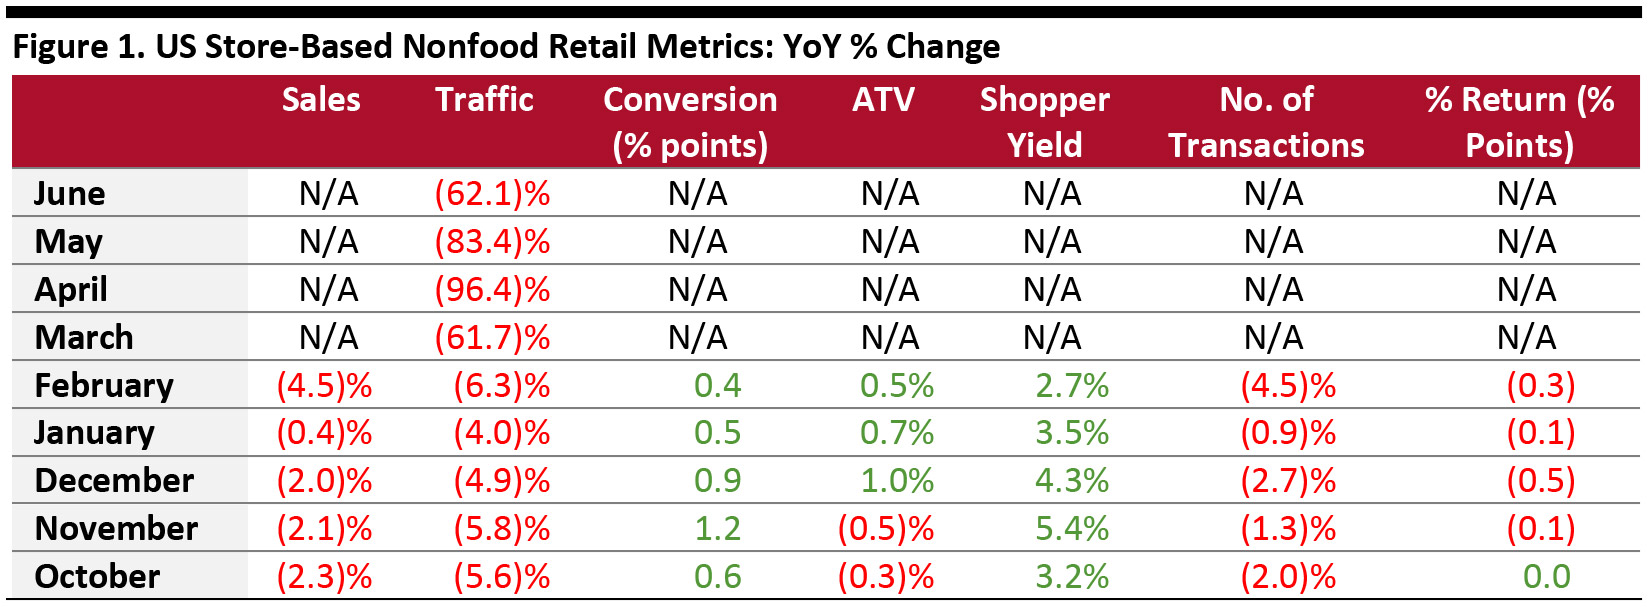 ATV = average transaction value, % return = percentage of goods returned to stores
Source: RetailNext [/caption] Traffic by Retailer Vertical While nonessential retailers were severely impacted in March and April by temporary store closures due to Covid-19 lockdowns, traffic improved in May, with most states authorizing retailers to reopen in stages. Traffic further improved in June, with nonessential retailers experiencing an aggregate 62.1% decline in shopper traffic versus May’s 83.4% decline. However, performances varied across industry verticals in June:
- The first week saw a traffic decline of 76.6%, mostly in line with the last week of May.
- Declines decelerated to 65.5% in the second week and 55.2% in the third week.
- The traffic trends plateaued in the remainder of the month—the fourth week saw a decline of 55.8% and the fifth week recorded a decline of 55%—as Covid-19 cases increased in the South and West regions.
- Traffic during the Fourth of July holiday weekend was down 59.1% year over year, as many states reclosed areas or re-imposed curfews owing to the rise in the number of new coronavirus cases.
- Other than traffic, RetailNext did not publish the metrics for which it typically provides data, such as shopper yield and conversion rate.
ATV = average transaction value, % return = percentage of goods returned to stores Source: RetailNext [/caption] Traffic by Retailer Vertical While nonessential retailers were severely impacted in March and April by temporary store closures due to Covid-19 lockdowns, traffic improved in May, with most states authorizing retailers to reopen in stages. Traffic further improved in June, with nonessential retailers experiencing an aggregate 62.1% decline in shopper traffic versus May’s 83.4% decline. However, performances varied across industry verticals in June:
- The apparel sector experienced the largest traffic decline at 67.2%, followed by the jewelry sector, which saw a 66.7% decrease in traffic.
- The footwear sector posted the lowest decline in traffic at 48.4%, while the home sector reported a traffic decline of 51.5%.
- The first week posted the greatest decline of 47.4%. The decline lowered to 41.2% in the second week, and the third week posted the lowest decline at 35.1%.
- Traffic deteriorated in the remaining weeks of the month, as many states—including Louisiana, South Carolina and Texas—dropped in performance due to the pausing and reverting of reopening plans. The fourth week of June saw a traffic decline of 41.7%, and the fifth week, which included the Fourth of July weekend, posted a decline of 46.6%.
- The Northeast region saw the largest traffic decline of 72.6%, as many states were slow to reopen. Traffic improved during the fourth and fifth weeks in this region as reopening continued, most notably in New York City.
- The South posted the lowest decline in traffic at 54.2%, as this region included many states that were the first to lift restrictions. However, traffic deteriorated in the fourth and fifth weeks due to the pausing of retail reopening.
- The West posted a traffic decline of 58.9%, and the Midwest saw traffic decline by 58.4%.
- Traffic by mall location type declined between 38% and 69%, with strip malls outperforming other location types, with a decline of 38.4%.
- Outlets and lifestyle centers performed similarly and managed to outperform other locations, with declines of 57.5% and 58.3%, respectively.