DIpil Das
Our US Monthly Retail Traffic and In-Store Metrics Report reviews year-over-year changes in selected store-based metrics, including sales, traffic and conversion rates.
- US store-based traffic continued to fall in June, according to RetailNext. Retail traffic declined 5.8% year over year in June, slower than the 8.9% decline in May.
- The CVR (sales transactions as a percentage of traffic) advanced 0.3 percentage points in June following a growth of 0.2 and 0.1 percentage points in May and April, respectively.
- Product return rates advanced 0.2 percentage points in June after being flat in April and May.
ATV and shopper yield (SY) showed year-over-year gains for the sixth consecutive month. ATV continued a ten-month growth streak.
- ATV (Sales divided by transactions) grew 4.7% in June following 4.1% and 3.2% growth reported in May and April, respectively.
- SY (sales divided by traffic) grew 5.9% year over year in June following a 4.3% and 3.0% increase in May and April, respectively.
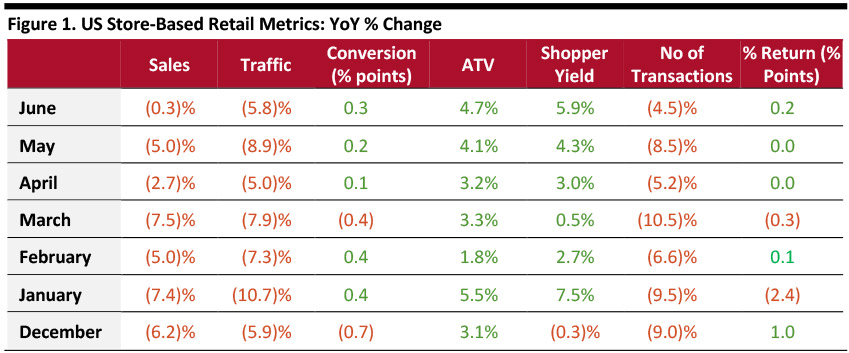 ATV = average transaction value, % Return = percentage of goods returned to stores
 Source: RetailNext [/caption]
Data for June showed that performance varied over the course of the four weeks:
- The last week of June, leading up to Independence Day weekend on July 4, performed best for sales, CVR, ATV, SY and transactions compared to the same week last year.
- June 14 (leading up to Father’s Day on June 16) performed best for CVR, June 15 performed best for sales, traffic, SY and transactions.
- Independence Day (July 4) reported low performance for traffic, sales and transactions as consumers celebrated instead of going shopping.
- The fourth week of June reported low performance in CVR, ATV and SY, all of which hit lows on June 29.
The west and midwest reported sales declines while the northeast and south reported increases in sales as they experienced the wettest conditions since June 2015.
All regions posted traffic declines in June. The midwest registered the largest year-over-year decline in traffic at 8.2%. The south experienced the lowest decline in traffic, at 3.4%.
The west and midwest recorded sales declines of 2.7% due to cooler weather. The northeast reported the largest year-over-year in-store sales increase at 5.6%, as it experienced the warmest weather conditions since 2017.