Nitheesh NH
The Coresight Research US Retail Traffic and In-Store Metrics series reviews changes in selected store-based metrics, as reported by RetailNext. In this month’s report, we review store traffic changes through July 2021—a month which saw a slight improvement in traffic trends even as the highly contagious Delta variant caused a new surge in Covid-19 cases and the pace of vaccination slowed. This series usually reviews year-over-year changes in store-based metrics; however, all March, April, May, June and July 2021 data in this report are compared to 2019 as stores began closing in March 2020 due to Covid-19 and most stores were closed in April, May, June and July 2020.
RetailNext’s coverage does not include food retailers but does include some other retail sectors deemed essential; the exclusion of food retail means that the figures cited below almost certainly overstate recent declines in total retail traffic.
Figure 1. US Store-Based Nonfood Retail Metrics: YoY % Change [caption id="attachment_131402" align="aligncenter" width="700"]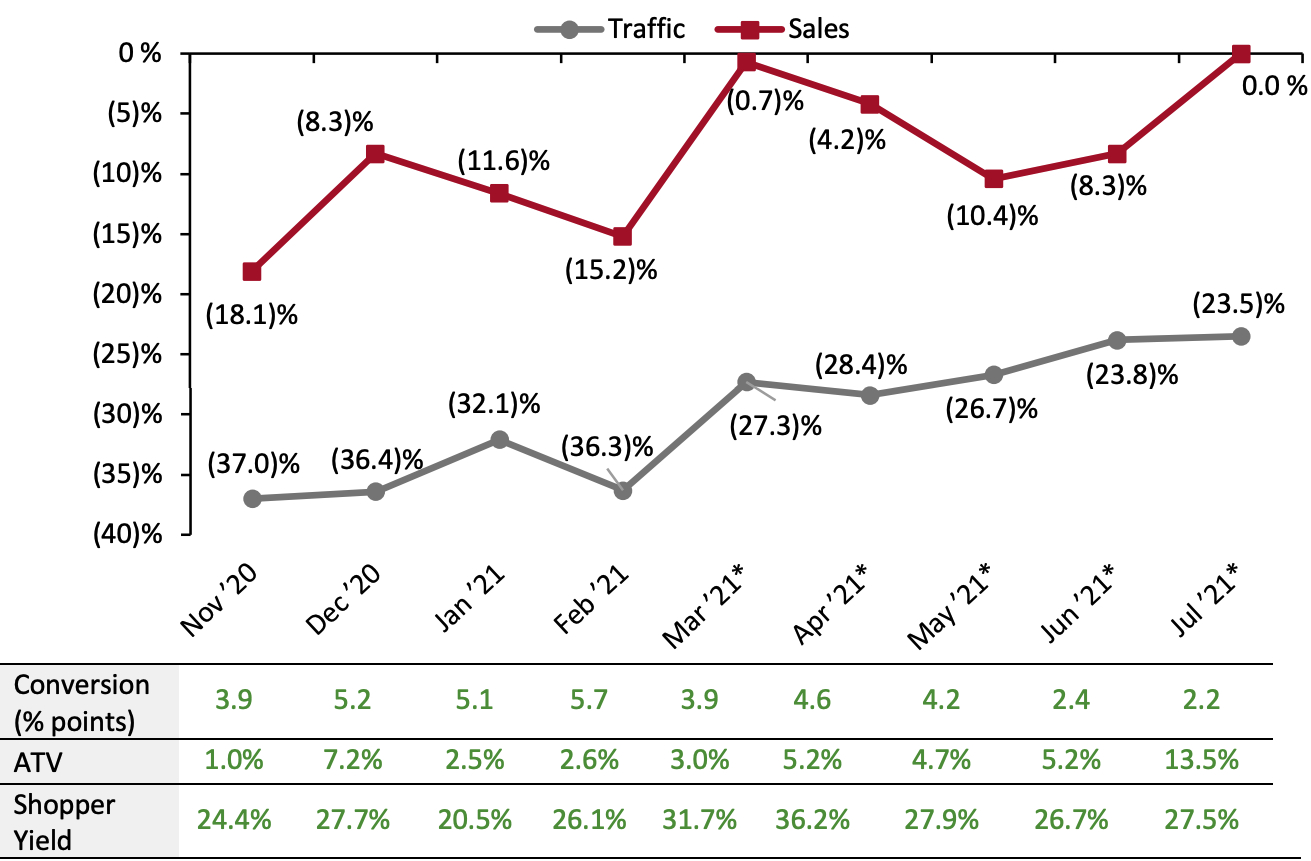 ATV=average transaction value; Shopper yield=Sales divided by traffic
*March, April, May, June and July 2021 numbers are compared to 2019 as stores began closing in March 2020 due to Covid-19 and most stores were closed in April, May, June and July 2020.
Source: RetailNext[/caption] Weekly Shopper Traffic Trends Weekly data for July tracks the progress of store traffic over four weeks (July 4–July 31, 2021):
Figure 2. US Retail Traffic by Industry Vertical: YoY % Change [caption id="attachment_131403" align="aligncenter" width="700"]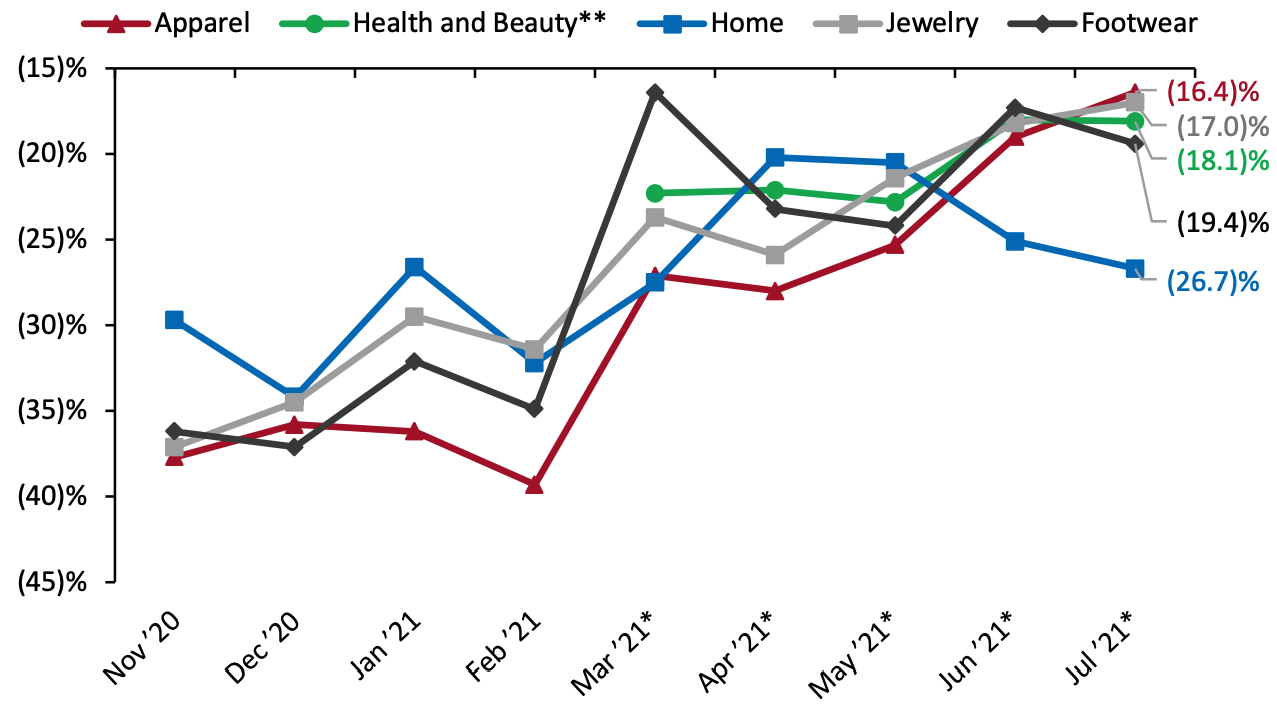 *March, April, May, June and July 2021 numbers are compared to 2019, as stores began closing in March 2020 due to Covid-19 and most stores were closed in April, May, June and July 2020.
**RetailNext started providing traffic trends for the health and beauty sector from March 2021.
Source: RetailNext[/caption] Regional Traffic Trends In July, the highly contagious Delta variant caused a new surge in Covid-19 cases, while the pace of vaccinations slowed. As a result, in the fourth week of the month, the CDC changed its mask policy, recommending that fully vaccinated people wear masks indoors. Furthermore, July was impacted by natural disasters. In the first week of the month, Hurricane Elsa landed in Florida and moved up the Southeast to the Mid-Atlantic region, causing strong winds and heavy rains. In the final week of July, heatwaves and wildfires spread across the US, impacting air quality and causing heat alerts in a wide range of states, from Georgia to Montana. Retail traffic in July varied across regions:
- July saw a slight improvement in traffic trends: Traffic declined by 23.5% on a two-year basis in July, stronger than June’s 23.8% decline versus 2019.
- The conversion rate (sales transactions as a percentage of traffic) grew 2.2 percentage points in July, versus June’s growth of 2.4 percentage points.
- In July, ATV (average transaction value, or sales divided by transactions) increased by 13.5%, with the growth rate more than doubling from June’s 5.2% increase. This fueled the sharp improvement in store-based sales, from a decline of 8.3% in June to flat in July.
- Shopper yield (sales divided by traffic) increased by 27.5% in July, higher than June’s 26.7% growth.
Figure 1. US Store-Based Nonfood Retail Metrics: YoY % Change [caption id="attachment_131402" align="aligncenter" width="700"]
ATV=average transaction value; Shopper yield=Sales divided by traffic*March, April, May, June and July 2021 numbers are compared to 2019 as stores began closing in March 2020 due to Covid-19 and most stores were closed in April, May, June and July 2020.
Source: RetailNext[/caption] Weekly Shopper Traffic Trends Weekly data for July tracks the progress of store traffic over four weeks (July 4–July 31, 2021):
- Traffic performed best in the first week of July, with declines of 21.3% on a two-year basis—a solid improvement from the final week of June, which saw a traffic decline of 27.9%. The improvement was mainly due to Independence Day weekend changing from the last week of June to the first week of July this year.
- Traffic declines accelerated slightly to 23.4% in the second week of July and improved marginally in the third week to 23.2%.
- Traffic declines accelerated to 25.3% in the fourth week as the Delta variant spread and Covid-19 cases spiked. During the fourth week, the Center for Disease Control and Prevention (CDC) recommended that fully vaccinated people wear masks indoors in areas with high transmission.
- The home sector reported the highest traffic decline of 26.7%, an increase of 160 basis points compared to June.
- The apparel sector posted the lowest traffic decline at 16.4%, an improvement of 260 basis points compared to June.
- The jewelry sector was the second best-performing category, with a traffic decline of 17.0%, an improvement of 120 basis points compared to June.
- The health and beauty sector saw a traffic decrease of 18.1%, an improvement of 10 basis points from June.
- The footwear sector posted a traffic decrease of 19.4%, an increase of 210 basis points compared to June.
Figure 2. US Retail Traffic by Industry Vertical: YoY % Change [caption id="attachment_131403" align="aligncenter" width="700"]
*March, April, May, June and July 2021 numbers are compared to 2019, as stores began closing in March 2020 due to Covid-19 and most stores were closed in April, May, June and July 2020.**RetailNext started providing traffic trends for the health and beauty sector from March 2021.
Source: RetailNext[/caption] Regional Traffic Trends In July, the highly contagious Delta variant caused a new surge in Covid-19 cases, while the pace of vaccinations slowed. As a result, in the fourth week of the month, the CDC changed its mask policy, recommending that fully vaccinated people wear masks indoors. Furthermore, July was impacted by natural disasters. In the first week of the month, Hurricane Elsa landed in Florida and moved up the Southeast to the Mid-Atlantic region, causing strong winds and heavy rains. In the final week of July, heatwaves and wildfires spread across the US, impacting air quality and causing heat alerts in a wide range of states, from Georgia to Montana. Retail traffic in July varied across regions:
- The Midwest was the worst-performing region along with the Northeast (discussed below), witnessing a traffic decline of 25.4% as compared to 2019. The region saw its largest traffic declines in the fourth week, mainly due to heat and wildfires.
- On par with the Midwest, the Northeast also posted an overall traffic decline of 25.4%. Over the first three weeks, traffic was consistently down at around 25.0% as compared to 2019, but the decline accelerated in the fourth week. First week traffic trends were impacted by Hurricane Elsa, which flooded New York City’s subway stations and major roads.
- The South posted the strongest traffic performance for the month, declining by 19.5% compared to 2019. The region outperformed all other regions in all four weeks of the month. The South region saw its best traffic trends in the first week, mainly driven by Independence Day celebrations shifting from the end of the previous month—even as several states were affected by Elsa in the latter half of the week.
- The West posted a 21.8% traffic decline for the month. The region’s traffic was strongest in the first week, with a traffic decline of 19.2%, and deteriorated toward the end of the month to 23.7%.
- Traffic by mall location type declined between 11.1% and 26.1%. Strip malls outperformed all other location types, with a decline of only 11.1%. These locations benefited from being open-air and from the presence of nondiscretionary retailers, such as food retailers.
- Other retail locations, including airports, casinos and hotels, reported the second-best performance, with a traffic decline of 13.3%— an improvement from June’s 23.8% decline. Many of these locations are situated in destination areas and likely witnessed an improvement in foot traffic as more consumers visited tourist locations due to the easing of travel restrictions.
- Traditional malls reported a traffic decline of 18.0%—an improvement from June’s 19.8% decline.
- Lifestyle centers and outlet locations outperformed the national average, with declines of 21.8% and 19.0%, respectively.
- Street-front/freestanding locations witnessed the largest traffic decline, of 26.1%, while luxury locations reported the second-largest traffic decline of 25.1%.