DIpil Das
US Retail Sales: July 2021
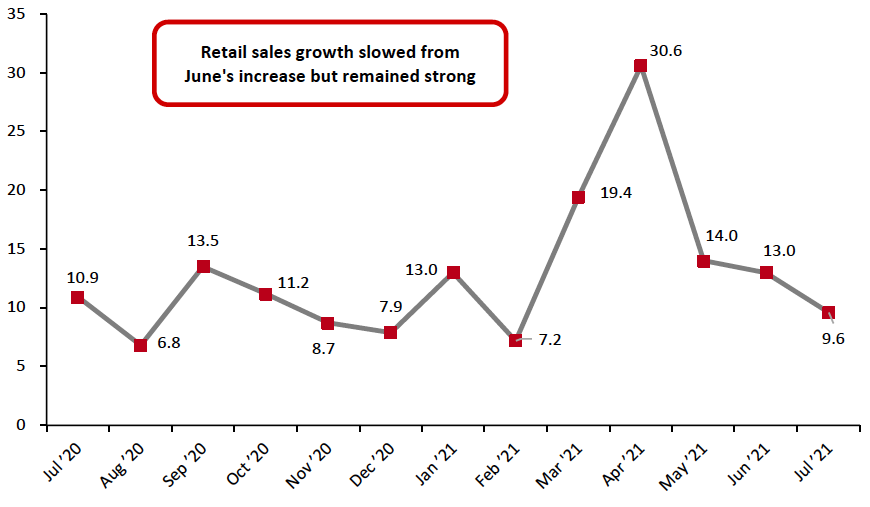
Coresight Research’s measure of core retail sales is the unadjusted year-over-year change, excluding gasoline and automobiles. This metric slowed to a still-strong 9.6% in July, from 13.0% (revised value) in June, as reported by the US Census Bureau on August 17, 2021. July’s growth was in line with Coresight Research’s forecast of year-over-year sales growth of about 10%. The slowdown in July’s growth may be partly attributed to consumer concern about the spread of the Covid-19 Delta variant impacting spending behaviors. However, overall demand for goods continues to remain strong even as consumer spending is shifting back to services, and we saw a strengthening in traffic trends in July despite a surge in new Covid-19 cases.Figure 1. US Total Retail Sales ex. Gasoline and Automobiles: YoY % Change [caption id="attachment_132782" align="aligncenter" width="700"]
 Data are not seasonally adjusted
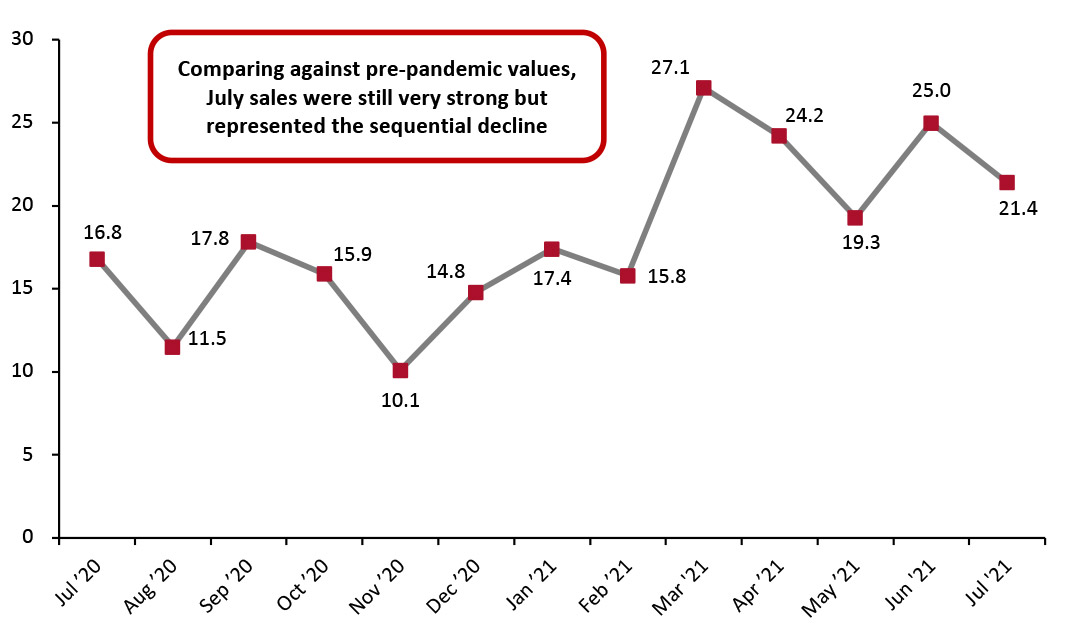
 Source: US Census Bureau/Coresight Research [/caption] In relation to the more consistent comparatives of 2019, July retail sales were still weaker than June’s. July sales grew 21.4% from 2019 values, down3.6 percentage points from June’s growth. However, on a two-year basis, this was the fourth-strongest growth in sales in the past year (see Figure 2).
Figure 2. US Total Retail Sales ex. Gasoline and Automobiles: % Change from Two Years Prior [caption id="attachment_131514" align="aligncenter" width="726"]
 Source: US Census Bureau/Coresight Research[/caption]
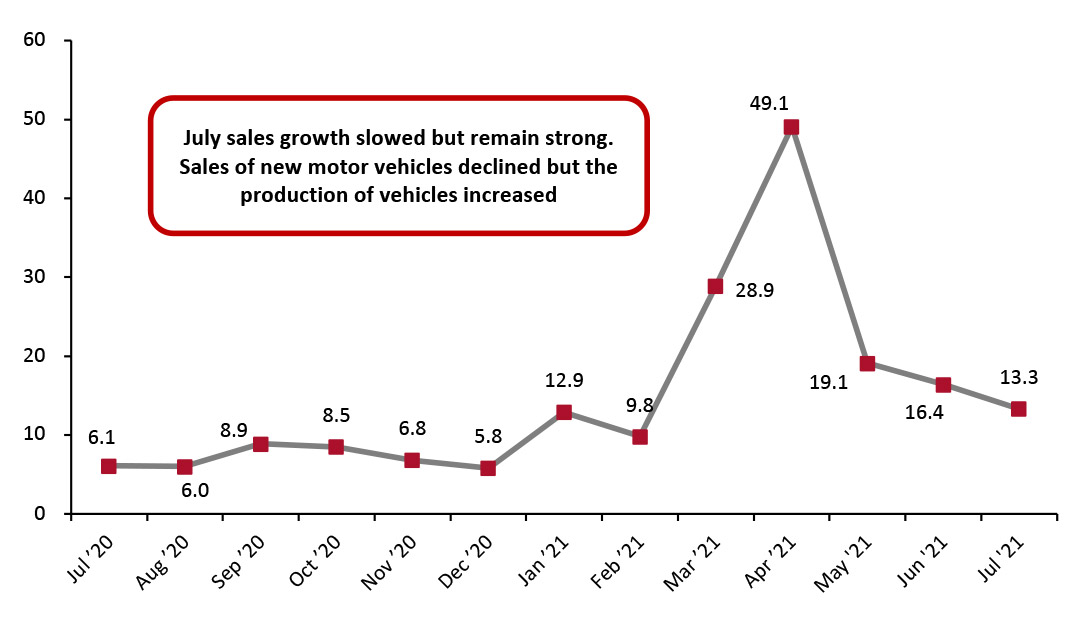
Seasonally adjusted retail sales, including automobiles and gasoline, grew 13.3% year over year, versus June’s 16.4% growth. In July, the sales of new motor vehicles continued to decline due to a global semiconductor scarcity.
Source: US Census Bureau/Coresight Research[/caption]
Seasonally adjusted retail sales, including automobiles and gasoline, grew 13.3% year over year, versus June’s 16.4% growth. In July, the sales of new motor vehicles continued to decline due to a global semiconductor scarcity.
Figure 3. US Total Retail Sales incl. Gasoline and Automobiles: Seasonally Adjusted YoY % Change [caption id="attachment_131515" align="aligncenter" width="725"]
 Data are seasonally adjusted
 Source: US Census Bureau/Coresight Research [/caption] Sales Decrease Month over Month On a month-over-month basis, seasonally adjusted sales (excluding automobiles and gas) decreased by 1.5% in July, versus a 0.5% increase in June. However, the overall trend for sales remains largely positive: Sharp spikes in January and March more than compensate for the recent slight declines.
Figure 4. US Total Retail Sales ex. Gasoline and Automobiles: MoM % Change [caption id="attachment_131516" align="aligncenter" width="726"]
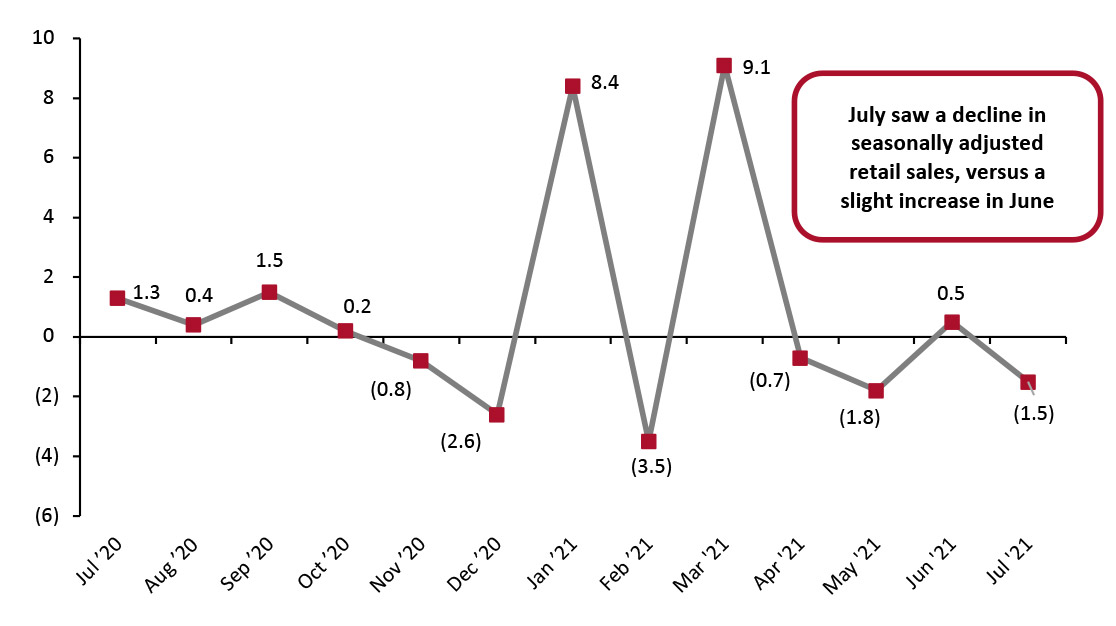 Data are seasonally adjusted
 Source: US Census Bureau/Coresight Research [/caption] Retail Sales Growth by Sector Although overall retail sales saw double-digit sales growth in July 2020, the spread of Covid-19 through the US last spring hit some sectors much harder than others. To control for the effects of the pandemic in 2020’s retail sales figures, we largely compare July 2021 sales to pre-pandemic July 2019 sales in this section. In a very strong month, eight sectors saw sales growth of 15% or more from 2019 levels:
- Sporting goods and hobby store sales rose 38.2% from 2019 values. Compared to 2020 values, the sector saw growth of 14.5% year over year.
- Nonstore retailers continued to thrive in July, with sales growing 31.2% from 2019 values. This sector saw sales growth of 3.7% from 2020, when many states saw major spikes in coronavirus cases. This prompted some states to pause or roll back reopening plans, pushing sales online. Continued surges in this sector, even as stores across the country are now open without restrictions, suggest that there will not be a post-pandemic e-commerce retrenchment.
- Miscellaneous store retailers saw solid sales growth of 30.4% from 2019, a slight acceleration from June’s 29.1% growth.
- Home-improvement retailers saw growth of 23.3% from pre-pandemic values, keeping sales at the heightened levels we have seen for the past year.
- Furniture and home-furnishings stores—which did not perform nearly as well as home-improvement retailers amid the outbreak of Covid-19—continued their strong performance, recording growth of 20.6% in July 2021 compared to July 2019. This is slightly below the 22.3% growth in June on a two-year basis.
- Clothing and clothing accessories stores saw solid sales growth of 19.3% from 2019 levels, versus June’s 20.0% growth from 2019. This supports our expectation of strong recovery in the overall US apparel and footwear market in 2021.
- General merchandise stores saw sales growth of 17.9% on a two-year basis, higher than June’s 13.6% growth. The department stores subsector saw a robust recovery, with sales growth of 9.6% based on 2019 levels, versus a 6.1% increase in June.
- Food and beverage stores continued to see elevated sales, rising 16.3% from 2019 levels and 2.9% from 2020 levels. Grocery stores saw 15.5% growth from 2019 and2.7% growth from 2020. While the year-over-year increases are far lower than in most other categories, they represent strong performance from the grocery industry following very demanding 2020 comparatives, which have caused major grocers to project sales declines in 2021 in the low single digits.
- Health and personal care store sales grew 13.9% from 2019 values, versus June’s growth of 17.1% from 2019.
Figure 5. US Total Retail Sales, by Sector: YoY % Change from 2020 (Top) and 2019 (Bottom) [wpdatatable id=1199 table_view=regular] [wpdatatable id=1200 table_view=regular]
Data are not seasonally adjusted Source: US Census Bureau/Coresight Research