DIpil Das
What’s the Story?
In our Leading Indicators of US Retail Sales monthly series, we examine several key macroeconomic indicators of US retail sales and analyze how they may impact the industry in the months to come. We analyze the latest available data, as of the end of July 2021, from sources such as the US Census Bureau, the US Bureau of Economic Analysts (BEA), the US Bureau of Labor Statistics (BLS) and the US Department of Housing and Urban Development (HUD).Why It Matters
Macroeconomic indicators have a significant impact on overall retail sales growth. Looking at 10 indicators (unemployment rate, labor force participation rate, disposable income per capita, average hourly wages, consumer sentiment, saving rate, gas price, federal funds rate, housing starts and housing prices), we can historically account for a majority of the variation in retail sales growth and create a strong basis for predicting sales moving forward. The close correlation between retail sales growth predictions based on economic indicators and actual retail sales growth is shown in Figure 1.Figure 1. US Actual Retail Sales ex. Auto and Gas Sales vs. Model Predicted Sales, January 2000–January 2021 (YoY % Change) [caption id="attachment_131339" align="aligncenter" width="725"]
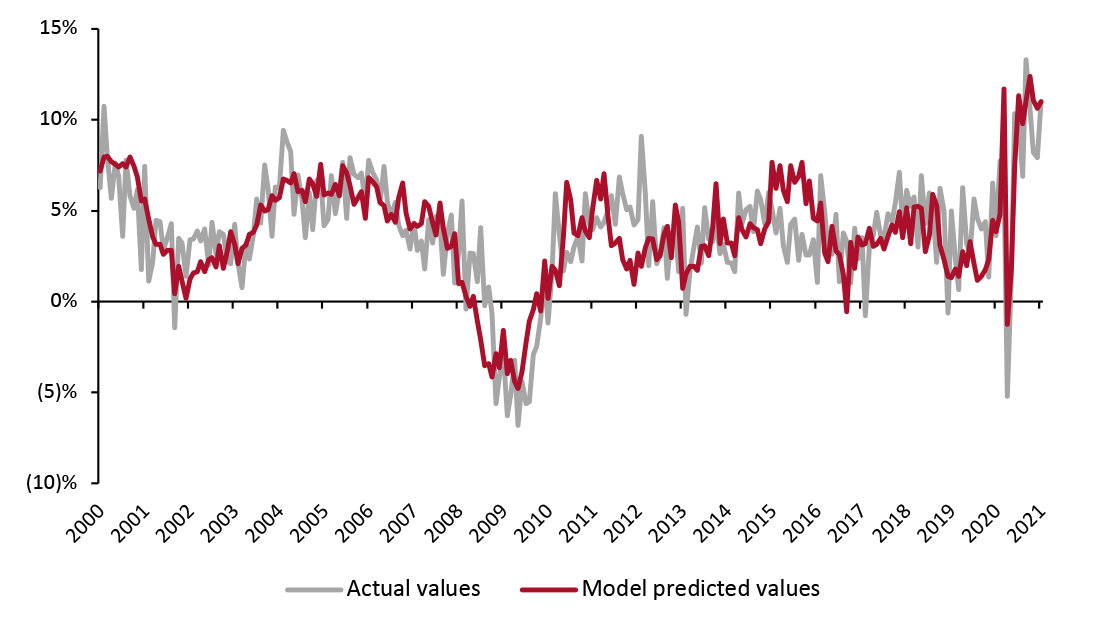 Source: BEA/BLS/Federal Reserve Board of Governors/S&P/Coresight Research[/caption]
In June, retail sales growth decelerated from the high levels recorded during March through May, returning to still-healthy levels in line with the second half of 2020, against tough year-over-year comparatives. Our model calls for a roughly 10% increase in retail sales during July and August as we transition through a healthy back-to-school season and approach the holiday shopping season.
Source: BEA/BLS/Federal Reserve Board of Governors/S&P/Coresight Research[/caption]
In June, retail sales growth decelerated from the high levels recorded during March through May, returning to still-healthy levels in line with the second half of 2020, against tough year-over-year comparatives. Our model calls for a roughly 10% increase in retail sales during July and August as we transition through a healthy back-to-school season and approach the holiday shopping season.
Leading Indicators of US Retail Sales: In Detail
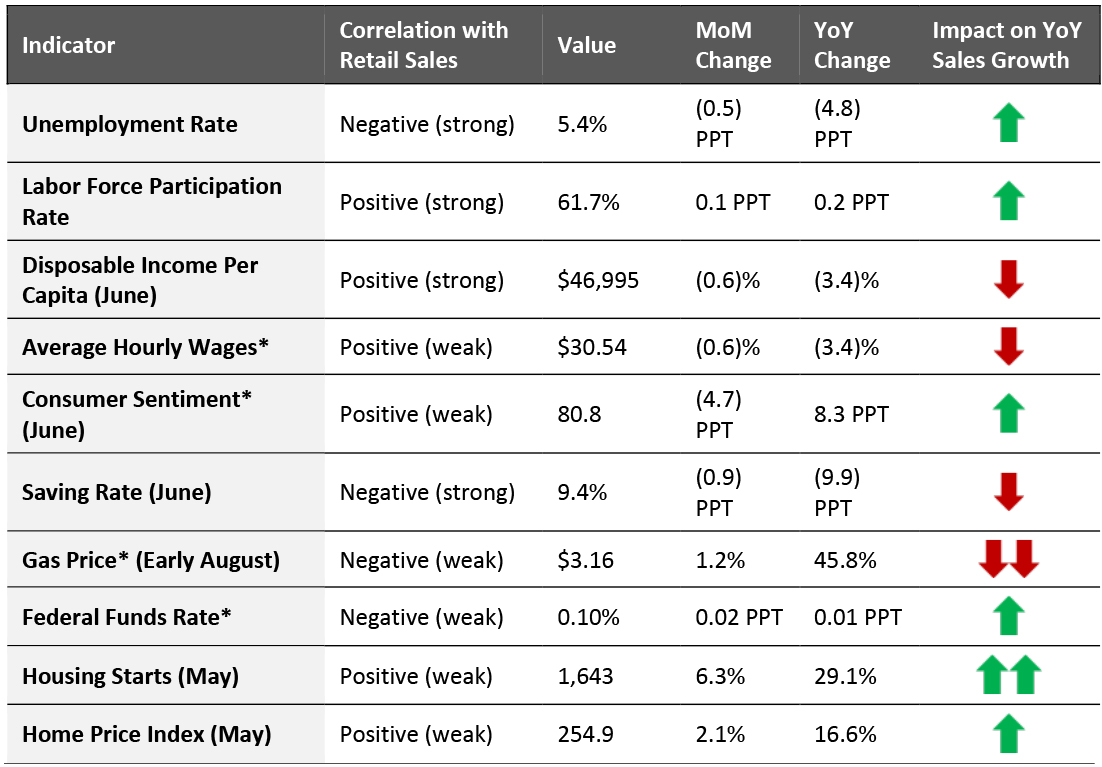
Indicators Overview Of the 10 indicators we examined, six are likely to have a positive impact on retail sales in the coming months. Both the unemployment rate and the labor force participation rate improved, but disposable income and wages declined month over month. Consumer sentiment has shown volatility, with a decline in July’s preliminary figure. Gas and housing prices continue to rise.Figure 2. US: Leading Indicators of Retail Sales, as of the End of July 2021 [caption id="attachment_131340" align="aligncenter" width="726"]
 Latest available data from July unless otherwise indicated
 *Not included in predictive model
Source: BEA/BLS/Federal Reserve Board of Governors/S&P/University of Michigan/US Energy Information Administration/Coresight Research [/caption] Looking ahead to soon-to-be-reported July retail sales (at the time of publication) and projected sales in August, we expect retail sales to increase by 9.9% year over year, as illustrated in Figure 3. This is roughly one-third of the growth experienced in April and May and is in line with previous growth trends in the second half of 2020.
Figure 3. US Retail Sales ex. Auto and Gas (YoY % Change)
[caption id="attachment_131634" align="aligncenter" width="700"]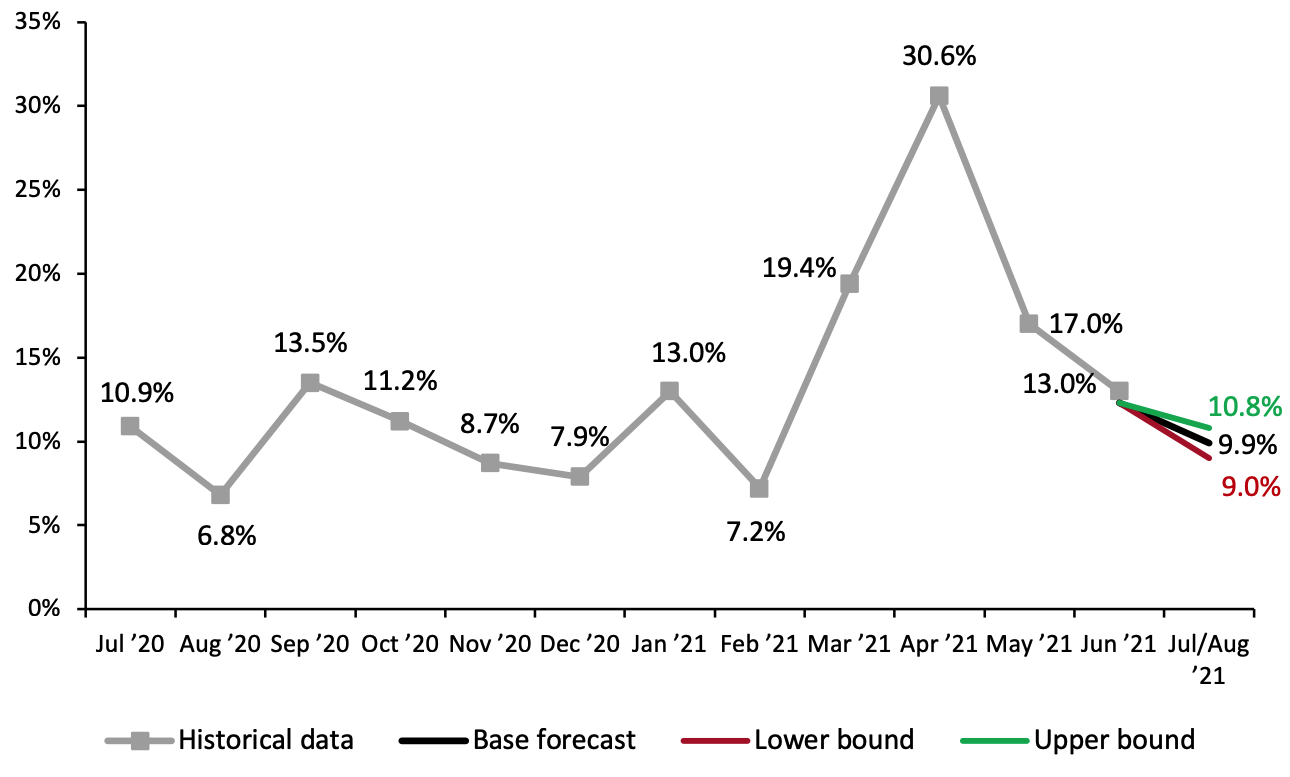 Source: BEA/BLS/Federal Reserve Board of Governors/S&P/Coresight Research[/caption]
The Job Market
Businesses are still unable to fill many vacancies, owing to a combination of high savings levels, generous government benefits and numerous workers having moved away from urban areas. Many restaurants and retailers are also competing for workers, raising their minimum wages to $15 per hour. As of the end of June, the US posted a record 10.1 million job vacancies, according to the BLS. Many employers are offering perks to attract workers, including college-tuition reimbursement and 401(k) plans.
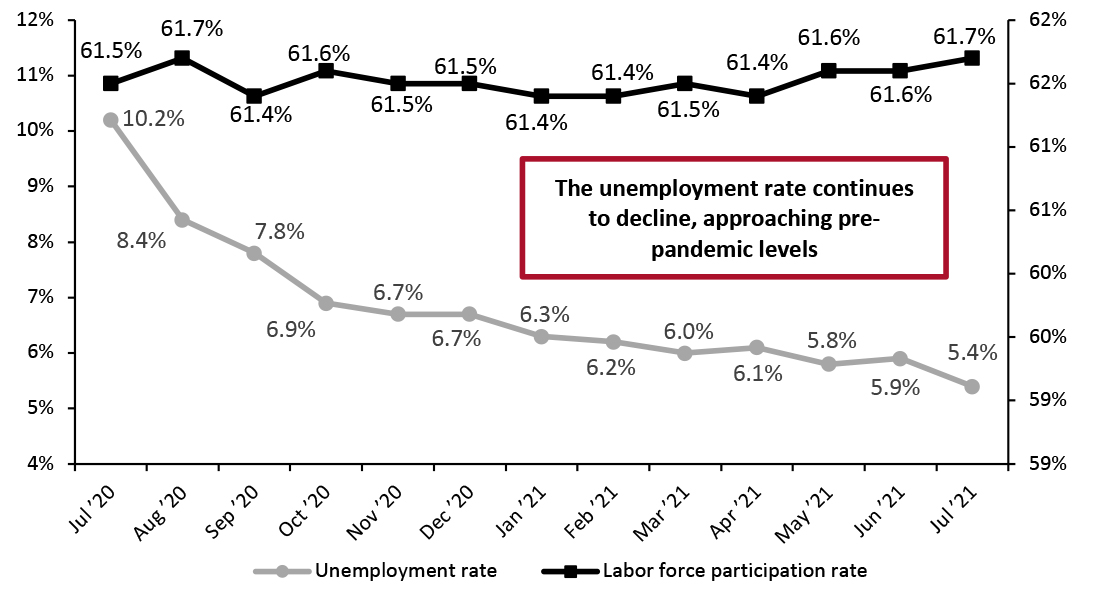
In July, the labor force participation rate increased, reaching 61.7%—the highest rate since August 2020. The unemployment rate declined from 5.9% to 5.4%, approaching the 5.0% rate typically considered as “full employment” by economists. In July, the US added 943,000 workers in nonfarm payrolls. The fastest job growth was in leisure and hospitality, indicating a rebound in those sectors, as well as education and professional and business services. The retail sector posted a loss of 6,000 jobs.
Source: BEA/BLS/Federal Reserve Board of Governors/S&P/Coresight Research[/caption]
The Job Market
Businesses are still unable to fill many vacancies, owing to a combination of high savings levels, generous government benefits and numerous workers having moved away from urban areas. Many restaurants and retailers are also competing for workers, raising their minimum wages to $15 per hour. As of the end of June, the US posted a record 10.1 million job vacancies, according to the BLS. Many employers are offering perks to attract workers, including college-tuition reimbursement and 401(k) plans.
In July, the labor force participation rate increased, reaching 61.7%—the highest rate since August 2020. The unemployment rate declined from 5.9% to 5.4%, approaching the 5.0% rate typically considered as “full employment” by economists. In July, the US added 943,000 workers in nonfarm payrolls. The fastest job growth was in leisure and hospitality, indicating a rebound in those sectors, as well as education and professional and business services. The retail sector posted a loss of 6,000 jobs.
Figure 4. US Unemployment Rate (Left Axis, %) and Labor Force Participation Rate (Right Axis, %) [caption id="attachment_131342" align="aligncenter" width="725"]
 Source: BLS[/caption]
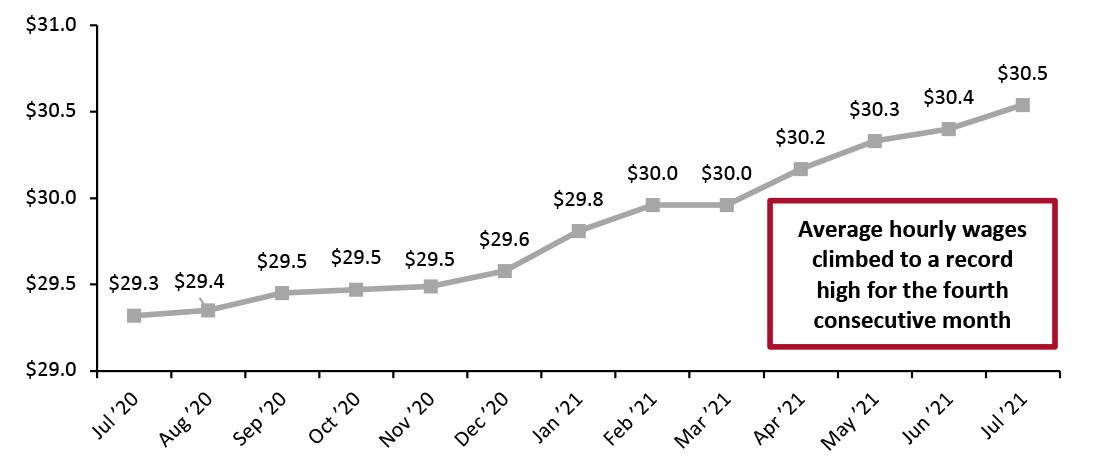
The highs in average hourly wages in the private sector continued in July, setting a new record of $30.54 per hour. While the month-over-month increase of $0.11 per hour is small in dollar terms, it is a meaningful figure considering the sheer scale of the US workforce.
Source: BLS[/caption]
The highs in average hourly wages in the private sector continued in July, setting a new record of $30.54 per hour. While the month-over-month increase of $0.11 per hour is small in dollar terms, it is a meaningful figure considering the sheer scale of the US workforce.
Figure 5. US Average Hourly Wages, All Private-Sector Employees (USD) [caption id="attachment_131343" align="aligncenter" width="725"]
 Source: BLS[/caption]
Implications
The shortage of available workers means service disruptions for restaurants and retailers. In some cases, higher wage offers have not attracted additional workers, as would be expected. Amazon and Target pay workers $15 an hour, and other employers—including fast-casual restaurants such as Chipotle—are also now offering a similar wage.
The worker shortage hits retailers during the back-to-school (BTS) shopping season, which is likely to see a surge in physical stores this year due to the resumption of in-person learning. It could become even more critical as BTS transitions into the important holiday shopping season. However, the recent surge in Covid-19 Delta cases may encourage some shoppers to make BTS purchases from home, relieving some of the pressure on the labor situation.
Income, Savings and Sentiment
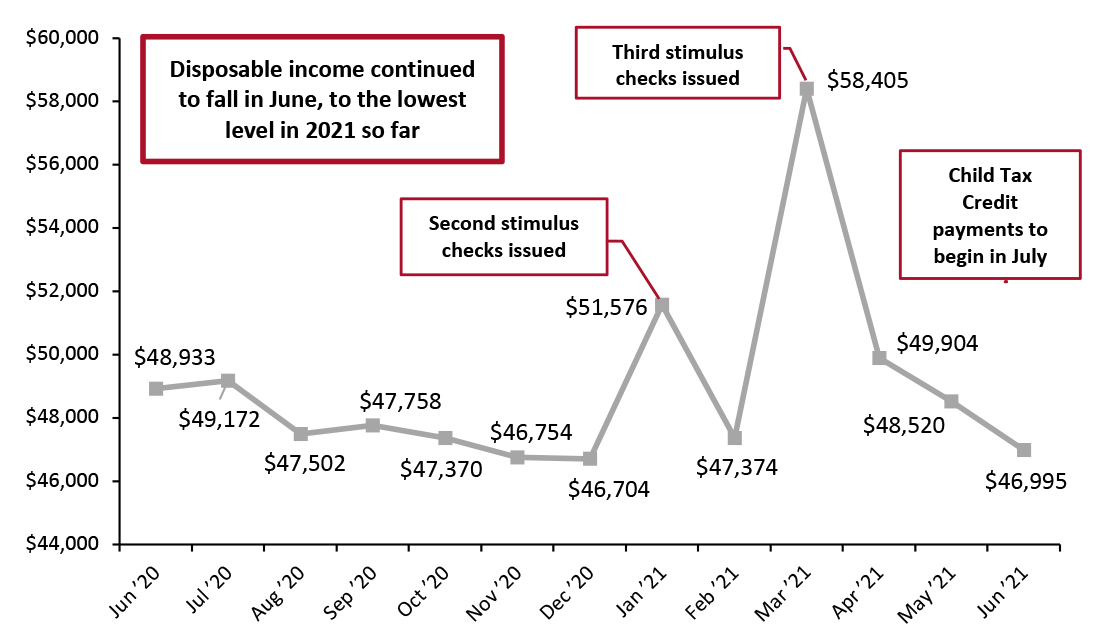
Following the stimulus-driven spike in March, real disposable income per capita has fallen substantially, down to $46,995 in June. Payments under the Child Tax Credit, which range from $3,000 to $3,600, will be paid out periodically from July.
Source: BLS[/caption]
Implications
The shortage of available workers means service disruptions for restaurants and retailers. In some cases, higher wage offers have not attracted additional workers, as would be expected. Amazon and Target pay workers $15 an hour, and other employers—including fast-casual restaurants such as Chipotle—are also now offering a similar wage.
The worker shortage hits retailers during the back-to-school (BTS) shopping season, which is likely to see a surge in physical stores this year due to the resumption of in-person learning. It could become even more critical as BTS transitions into the important holiday shopping season. However, the recent surge in Covid-19 Delta cases may encourage some shoppers to make BTS purchases from home, relieving some of the pressure on the labor situation.
Income, Savings and Sentiment
Following the stimulus-driven spike in March, real disposable income per capita has fallen substantially, down to $46,995 in June. Payments under the Child Tax Credit, which range from $3,000 to $3,600, will be paid out periodically from July.
Figure 6. US Annualized Real Disposable Income Per Capita (USD) [caption id="attachment_131344" align="aligncenter" width="724"]
 Source: BEA[/caption]
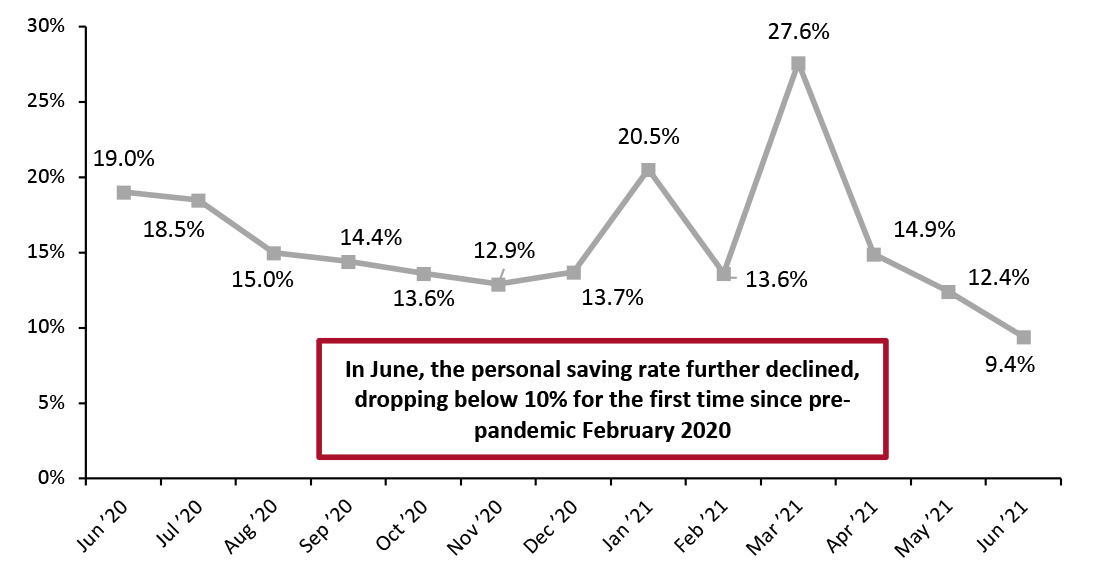
The personal saving rate and real disposable income per capita rose following every round of stimulus payments, before dropping the following month. This pattern held in April, following the issuance of the third round of stimulus checks. Declines in the saving rate after April are likely due to a combination of changing spending habits from pandemic recovery and stimulus payments drying up. The lower saving rate means that consumers have less dry powder for shopping splurges.
Source: BEA[/caption]
The personal saving rate and real disposable income per capita rose following every round of stimulus payments, before dropping the following month. This pattern held in April, following the issuance of the third round of stimulus checks. Declines in the saving rate after April are likely due to a combination of changing spending habits from pandemic recovery and stimulus payments drying up. The lower saving rate means that consumers have less dry powder for shopping splurges.
Figure 7. Personal Saving Rate (%) [caption id="attachment_131345" align="aligncenter" width="725"]
 Source: BEA[/caption]
Consumer confidence fell in May and rebounded in June—but preliminary data show that the index dropped to 80.8 in July. Consumers are concerned about inflation—University of Michigan survey findings suggest that the one-year inflation expectation in July increased to 4.8% from 4.2% in June. Consumers are likely also concerned about the rapid increase in Covid-19 Delta cases in several parts of the US and the reintroduction of mask-wearing requirements indoors in Los Angeles and other areas.
Source: BEA[/caption]
Consumer confidence fell in May and rebounded in June—but preliminary data show that the index dropped to 80.8 in July. Consumers are concerned about inflation—University of Michigan survey findings suggest that the one-year inflation expectation in July increased to 4.8% from 4.2% in June. Consumers are likely also concerned about the rapid increase in Covid-19 Delta cases in several parts of the US and the reintroduction of mask-wearing requirements indoors in Los Angeles and other areas.
Figure 8. University of Michigan Consumer Sentiment Index [caption id="attachment_131346" align="aligncenter" width="724"]
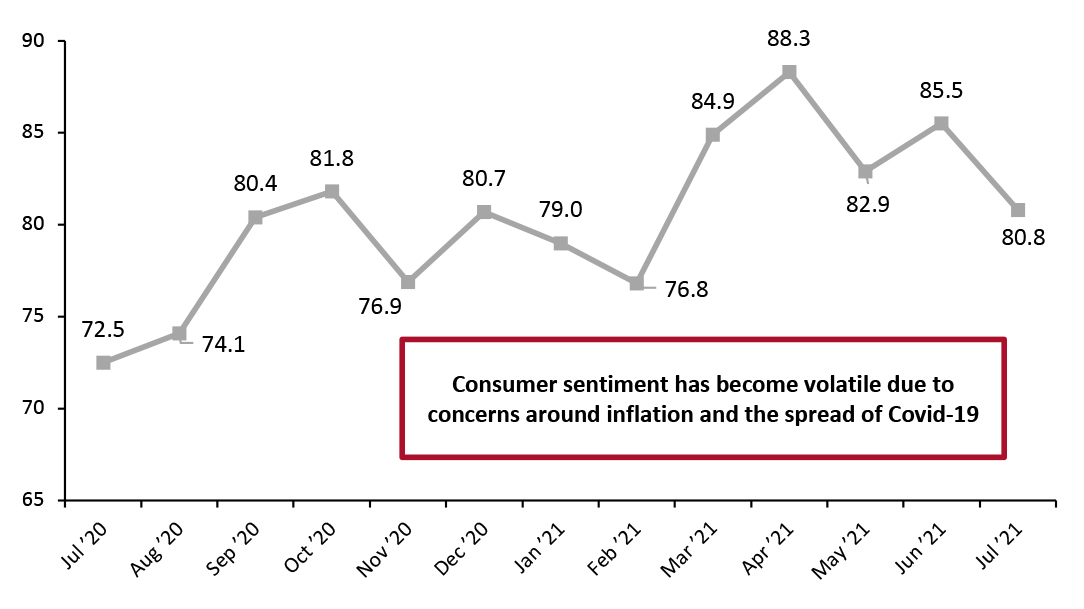 Note: July 2021 figure is preliminary
 Source: University of Michigan [/caption] Gas prices continue to rise dramatically, contributing to inflation concerns. Gas prices have now risen for nine consecutive months, reaching $3.16 in early August—up 1.2% month over month and up 45.8% year over year. Rising gas prices have an even greater impact as consumers increasingly venture outside their homes and travel during the summer vacation season.
Figure 9. US Regular All Formulations Gas Price (Dollars per Gallon) [caption id="attachment_131347" align="aligncenter" width="725"]
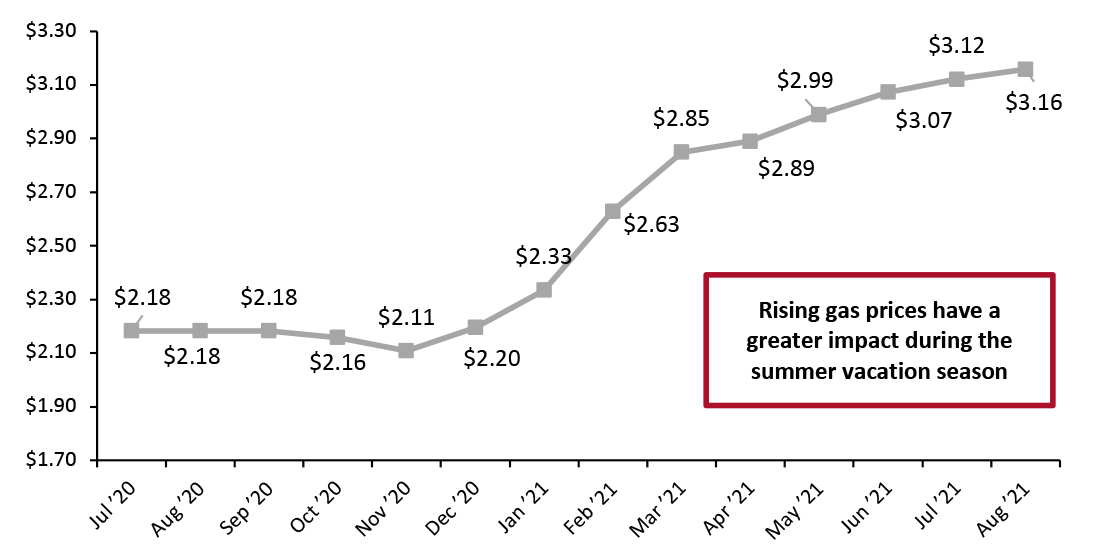 Source: US Energy Information Administration[/caption]
Implications
Higher gasoline prices have a multiplier effect throughout the entire economy, impacting the price of goods delivery as well as personal travel. Increased gas prices are likely contributing to consumer expectations of higher inflation, as the cost of filling up their gas tanks increases. They also reduce consumer disposable income, hitting lower-income consumers harder—as many need to drive to work and the cost of fuel represents a higher percentage of their income.
Housing
Despite a surge in March, housing starts fell in April and remained flat in May.
Home prices continued to climb in May (the latest month for which Case-Shiller Index data is available), reaching 254.0 points, up from 249.2 in April. Rising home prices create a wealth effect, making consumers feel more affluent and emboldening them to spend.
Source: US Energy Information Administration[/caption]
Implications
Higher gasoline prices have a multiplier effect throughout the entire economy, impacting the price of goods delivery as well as personal travel. Increased gas prices are likely contributing to consumer expectations of higher inflation, as the cost of filling up their gas tanks increases. They also reduce consumer disposable income, hitting lower-income consumers harder—as many need to drive to work and the cost of fuel represents a higher percentage of their income.
Housing
Despite a surge in March, housing starts fell in April and remained flat in May.
Home prices continued to climb in May (the latest month for which Case-Shiller Index data is available), reaching 254.0 points, up from 249.2 in April. Rising home prices create a wealth effect, making consumers feel more affluent and emboldening them to spend.
Figure 10. Housing Starts (Thousands, Left Axis) and Case-Shiller US Home Price Index (Right Axis) [caption id="attachment_131348" align="aligncenter" width="725"]
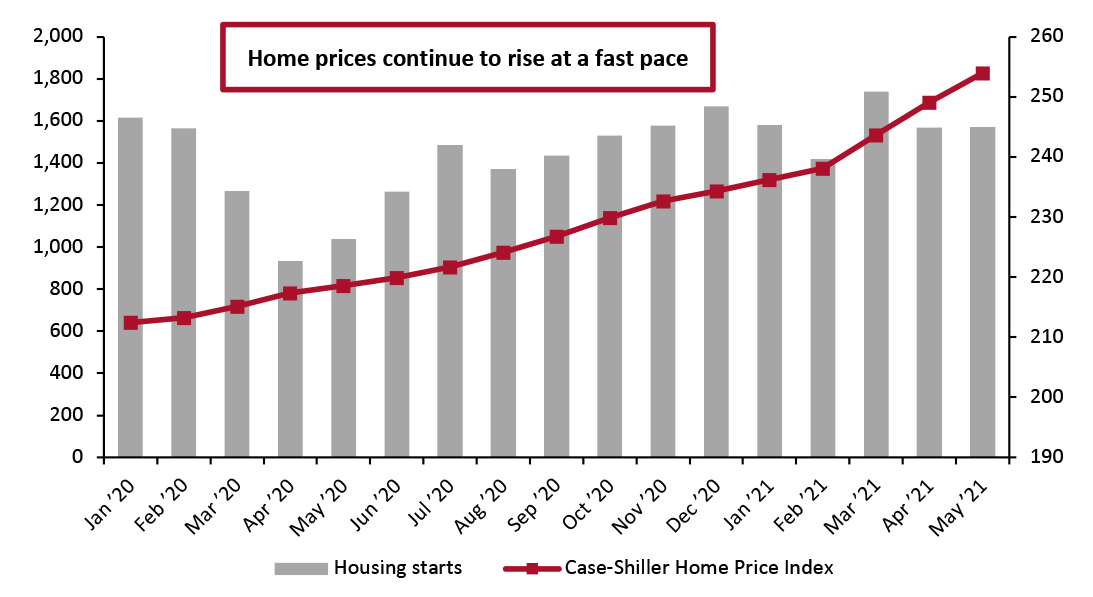 Source: HUD/US Census Bureau[/caption]
While the rise in housing prices causes some consumers to feel more affluent, it also means many are forced to rent rather than buy—which could dampen housing starts in the future.
Implications
In the past three reports in this series, we have commented on the meteoric rise in home prices, which is hindering the ability of consumers to buy homes, making the rental market tight. Nevertheless, rising home prices are likely to lure more developers into entering the housing market.
Source: HUD/US Census Bureau[/caption]
While the rise in housing prices causes some consumers to feel more affluent, it also means many are forced to rent rather than buy—which could dampen housing starts in the future.
Implications
In the past three reports in this series, we have commented on the meteoric rise in home prices, which is hindering the ability of consumers to buy homes, making the rental market tight. Nevertheless, rising home prices are likely to lure more developers into entering the housing market.
What We Think
June retail growth, although down from the prior two months, remained healthy. We expect that factors such as a decreasing unemployment rate, a new series of subsidies and the wealth effect should result in solid July sales. Implications for Brands/Retailers- The declining unemployment rate indicates that the already challenging labor market will become increasingly demanding for retailers, facing competition from other retailers and restaurants offering higher wages and perks. The cash provided by renewed government subsidy programs poses additional challenges.
- Consumer sentiment has been volatile during the past four months, due to a combination of the spread of the Covid-19 Delta variant and higher consumer inflation expectations. Consumers are likely reconsidering trips due to higher gas prices and the fear of future lockdowns.