
DIpil Das
China Retail Sales: July 2021
In July, China’s total retail sales (ex. food service, incl. automobiles and gasoline) grew 7.8% year over year, easing from 11.2% growth in June and representing the weakest growth in retail sales since December 2020, indicating that recovery is losing momentum. The National Bureau of Statistics attributed the slowdown to the combined impact of sporadic local Covid-19 outbreaks and natural disasters. Year-over-year growth was against weak comparatives—sales grew by 0.2% year over year in July 2020. Against pre-pandemic 2019 values, total sales in July 2021 saw moderate growth of 6.0%. The number of coronavirus cases in China is low compared to other countries. However, we anticipate that retail sales will continue to grow by single digits in the coming months, as China has taken a zero-tolerance approach to infections, implementing strict restrictions in several cities to fight its latest outbreaks.Figure 1. Total China Retail Sales (ex. Food Service; incl. Automobiles and Gasoline): YoY % Change [caption id="attachment_131494" align="aligncenter" width="726"]
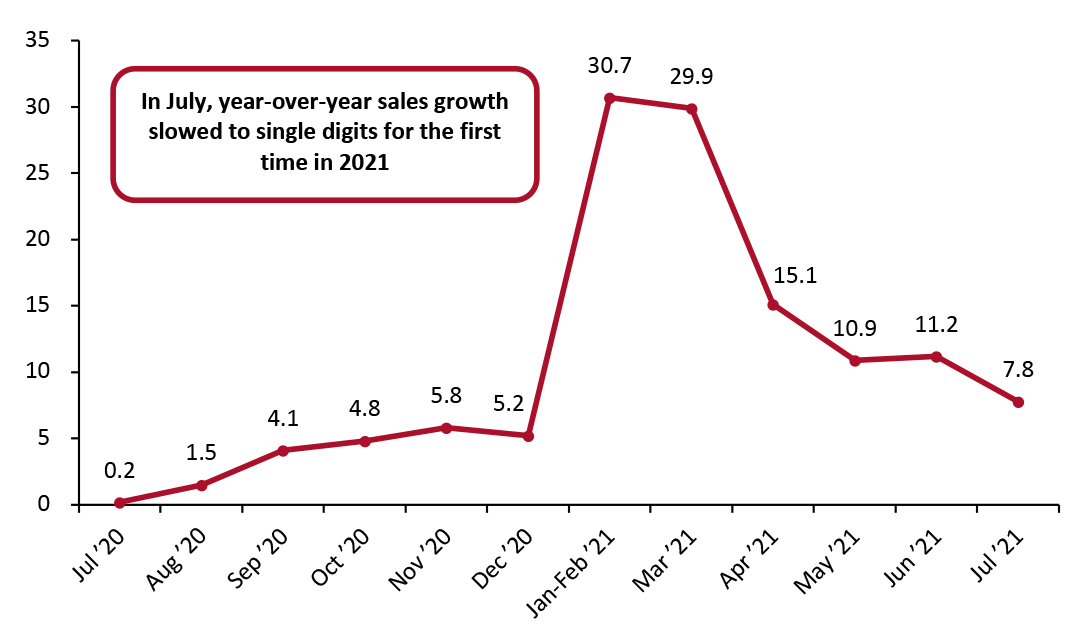 January and February figures are reported together
 Source: National Bureau of Statistics/Coresight Research [/caption] Retail Sales Growth by Sector All sectors except automobiles saw positive year-over-year growth in July. However, sales rose at a slower pace than the previous months for most categories:
- Gasoline saw the highest growth relative to other sectors in July, at 22.7%. However, if we compare absolute-value sales with pre-pandemic July 2019, the sector only experienced a 6.8% increase.
- Beverage retailers saw the second-highest growth in July, at 20.8%. On a two-year basis, the beverage sector grew 29.2%—easing from the 48.9% growth it recorded in June.
- The apparel and footwear sector grew by 7.5% year over year in July, slowing from a 12.8% increase in June. On a two-year basis, the sector grew by a modest 1.2%, compared to 7.6% in June. The domestic apparel sector has benefited from a recent shift in consumer spending—shoppers have increasingly opted for domestic fashion brands over international labels, expressing their support for Xinjiang Cotton.
- The beauty sector is witnessing continued softening in its year-over-year growth. In July, the sector saw a sales increase of 2.8%, down from 13.5% growth in June, 14.6% in May and 17.8% in April. However, on a two-year basis, sales by beauty retailers remained strong, registering 18.5% growth in July.
- The food sector has performed steadily overall, with little fluctuation during the Covid-19 crisis: Food retail sales in July 2021 saw growth of 11.3% year over year and 12.5% compared to the same period in 2019.
- Furniture and Chinese and Western medicine are the only two sectors that are yet to return to pre-pandemic sales levels. On a two-year basis, furniture retailers reported a year-over-year sales decline of 15.1%, while the Chinese and Western medicine sector saw a sales decline of 6.0%.
Figure 2. China Retail Sales (ex. Food Service; incl. Gasoline and Automobiles), by Sector: YoY% Change and Two-Year % Change [wpdatatable id=1198 table_view=regular]
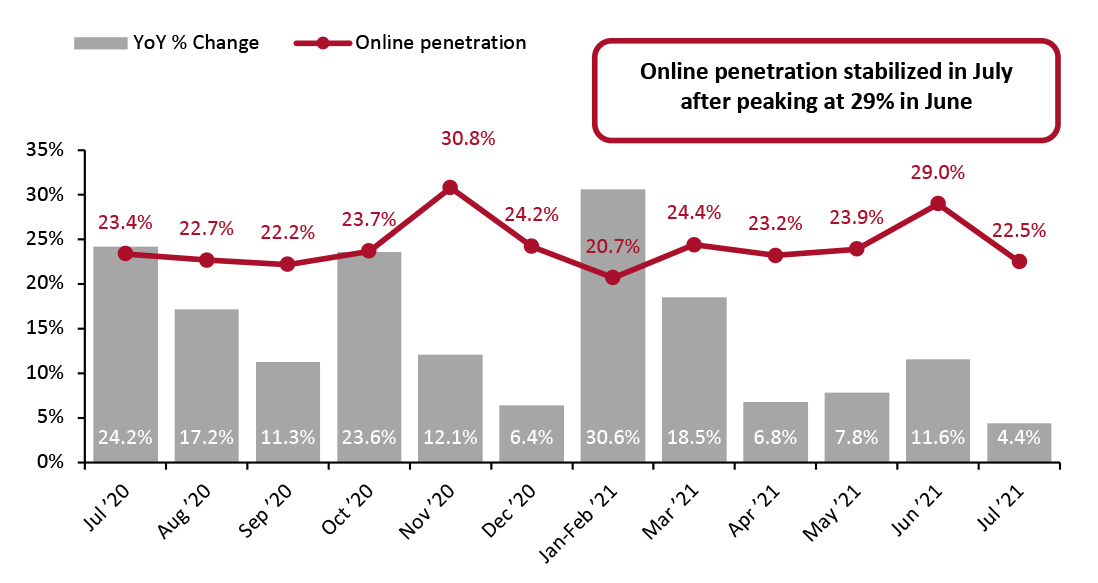
The sector breakdown is based on surveys from enterprises with annual sales of ¥5 million (around $730,000) and above Source: National Bureau of Statistics Online Retail Sales Account for 22.5% of All Retail Sales In July, online retail sales growth in China reached 4.4% year over year. The channel accounted for 22.5% of total retail sales in the period, down from June’s 29.0%. Elevated online penetration in June was partly due to the 6.18 Shopping Festival. Online retail sales include food service, as the National Bureau of Statistics does not provide online data that exclude food service. In Figure 3, online sales are benchmarked to total retail sales.
Figure 3. Online Retail Sales (YoY % Change) as a Proportion of Total Retail Sales (%) (incl. Automobiles, Gas and Food Service) [caption id="attachment_131495" align="aligncenter" width="725"]
 Online retail sales include food service
 January and February figures are reported together
Source: National Bureau of Statistics [/caption]