Nitheesh NH
The Coresight Research US Retail Traffic and In-Store Metrics report reviews year-over-year changes in selected store-based metrics as reported by RetailNext. In this month’s report, we review store traffic changes through July, when nonessential businesses continued to reopen in some states but spikes in the coronavirus cases forced retailers to pause or roll back reopening plans in some regions. RetailNext’s coverage does not include food retailers but does include some other retail sectors deemed essential; the exclusion of food retail means that the figures cited below almost certainly overstate recent declines in total retail traffic.
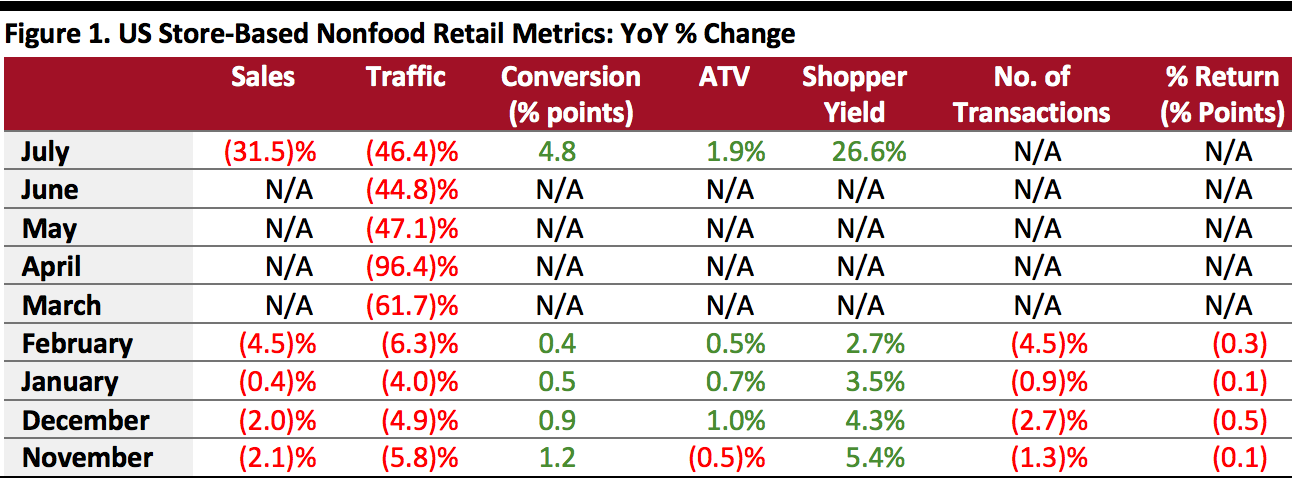 ATV=average transaction value; % Return=percentage of goods returned to stores
Source: RetailNext[/caption] Weekly Shopper Traffic Trends Weekly data for July tracks the progress of store reopenings over four weeks (July 5–August 1, 2020):
- Total US nonfood traffic declined 46.4% year over year in July versus June’s revised 44.8% decline, reflecting a stalled recovery for store-based discretionary retail.
- For July, RetailNext also published data for other metrics—conversion rate, average transaction value (ATV) and shopper yield—which were not provided from March to June. However, RetailNext did not publish the data for transaction volume and product return rates.
- The conversion rate (sales transactions as a percentage of traffic) advanced by 4.8 percentage points in July.
- In July, ATV (sales divided by transactions) increased by 1.9%, while shopper yield (sales divided by traffic) grew 26.6%.
ATV=average transaction value; % Return=percentage of goods returned to storesSource: RetailNext[/caption] Weekly Shopper Traffic Trends Weekly data for July tracks the progress of store reopenings over four weeks (July 5–August 1, 2020):
- Traffic declined by 45.3% in the first week and 45.4% in the second week, an improvement from the final week of June, which saw traffic decline by 46.6%.
- Declines accelerated to 46.6% in the third week of July and 46.5% in the fourth week as states began reversing or pausing reopening plans due to a spike in the number of coronavirus cases.
- The footwear sector experienced the greatest traffic decline at 50.7%, followed by the jewelry sector, which saw a 50.4% decrease in traffic.
- The apparel sector reported a traffic decline of 45.1%, while the home sector posted the lowest decline in traffic, at 26.2%.
- The West saw the greatest traffic decline of 48.2% as Covid-19 cases spiked throughout the month. California imposed a statewide rollback and reversed retail reopenings, including for indoor malls.
- The Midwest posted the lowest decline in traffic, at 40.6%, as this region saw a lower number of coronavirus cases than regions, with traffic trends improving slightly each week. However, as the number of cases started to rise in the last week of July, this trend is expected to slow in August.
- The Northeast posted a traffic decline of 44.7%, and the South saw traffic decline by 42.8%.
- Traffic by mall location type declined between 20% and 52%, with strip malls outperforming other location types by more than 18 percentage points, with a decline of only 20.8%.
- Street-front and standalone locations performed second best, with declines of 38.9%, while outdoor saw a decline of 43.0%.
- Luxury and traditional mall locations performed the worst, with declines of 52.2% and 48.0%, respectively.