DIpil Das
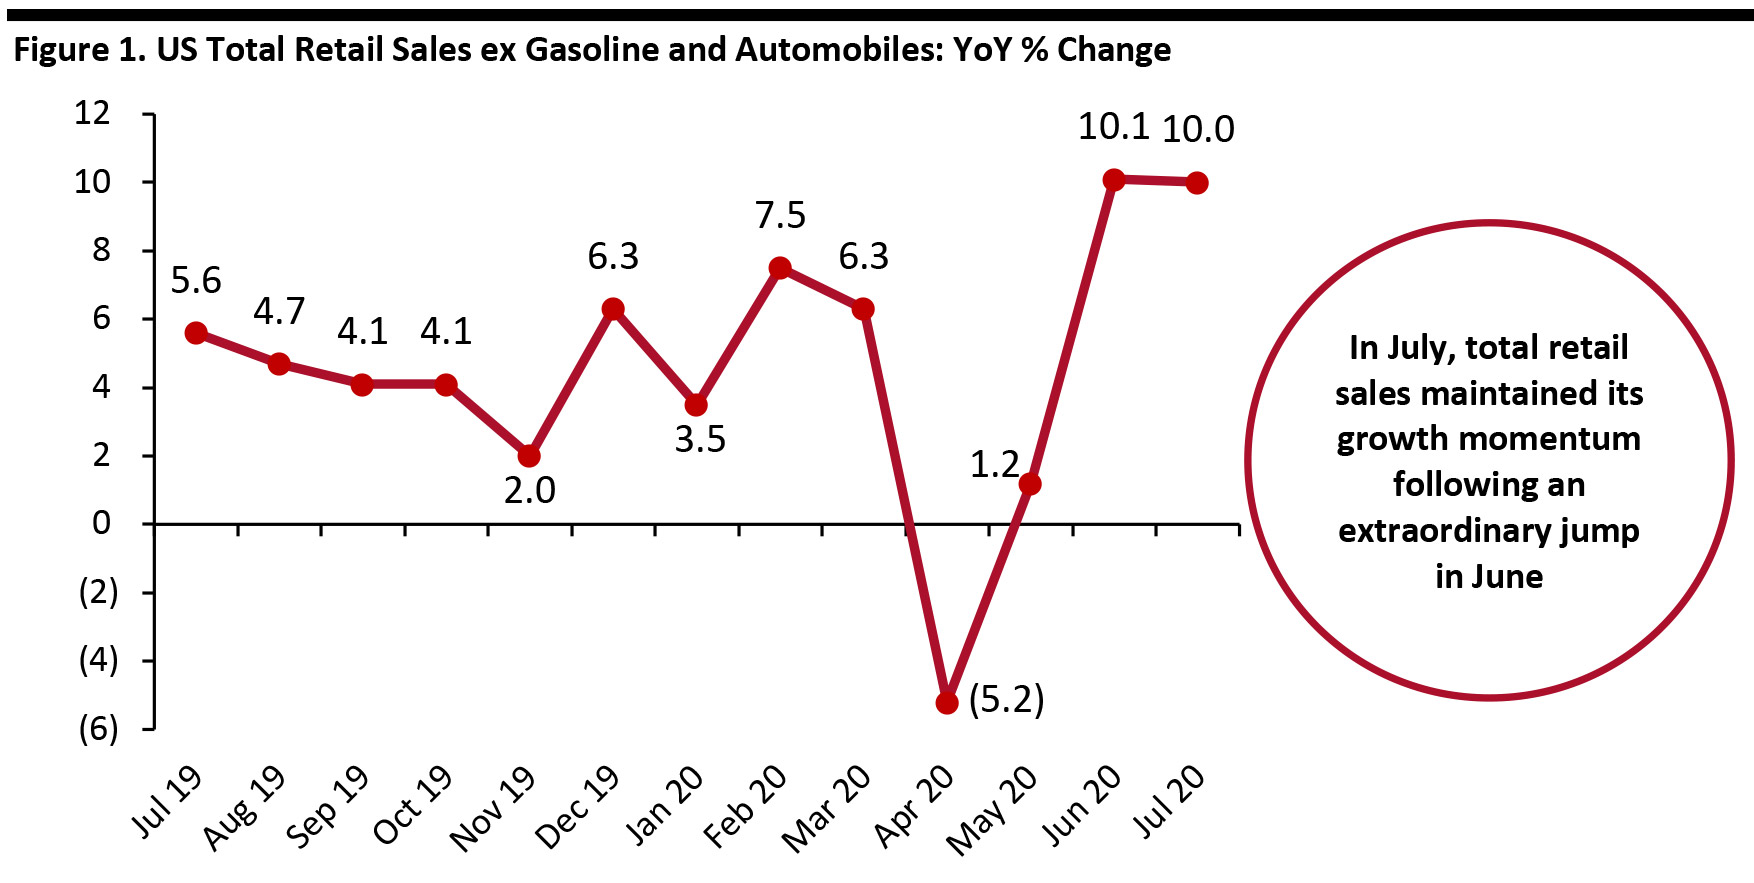
Amid still difficult circumstances, US retail sales maintained strong growth momentum in July following an extraordinary jump in June, fueled by double-digit growth in several sectors.
Coresight Research’s measure of core retail sales is the unadjusted year-over-year change, excluding gasoline and automobiles. This metric stood at 10.0% in July versus June’s 10.1% rate (which was revised up from an already very strong first estimate of 9.2%). The strongest growth was seen by nonstore retailers, home-improvement retailers and sports and leisure goods retailers, as we discuss later, suggesting demand for discretionary categories—although apparel stores remained a weak spot.
In the US, temporary store closures began in the week of March 8–14 and peaked in the week of March 15–21. Stores began to reopen in May following the easing of Covid-19 lockdowns by states and local governments. The reopening of US retail stores peaked in early June. In July, many states saw major spikes in coronavirus cases in the first and second weeks – this prompted some states to pause or roll back reopening plans in the third and fourth weeks of the month.
[caption id="attachment_114469" align="aligncenter" width="700"] Data are not seasonally adjusted
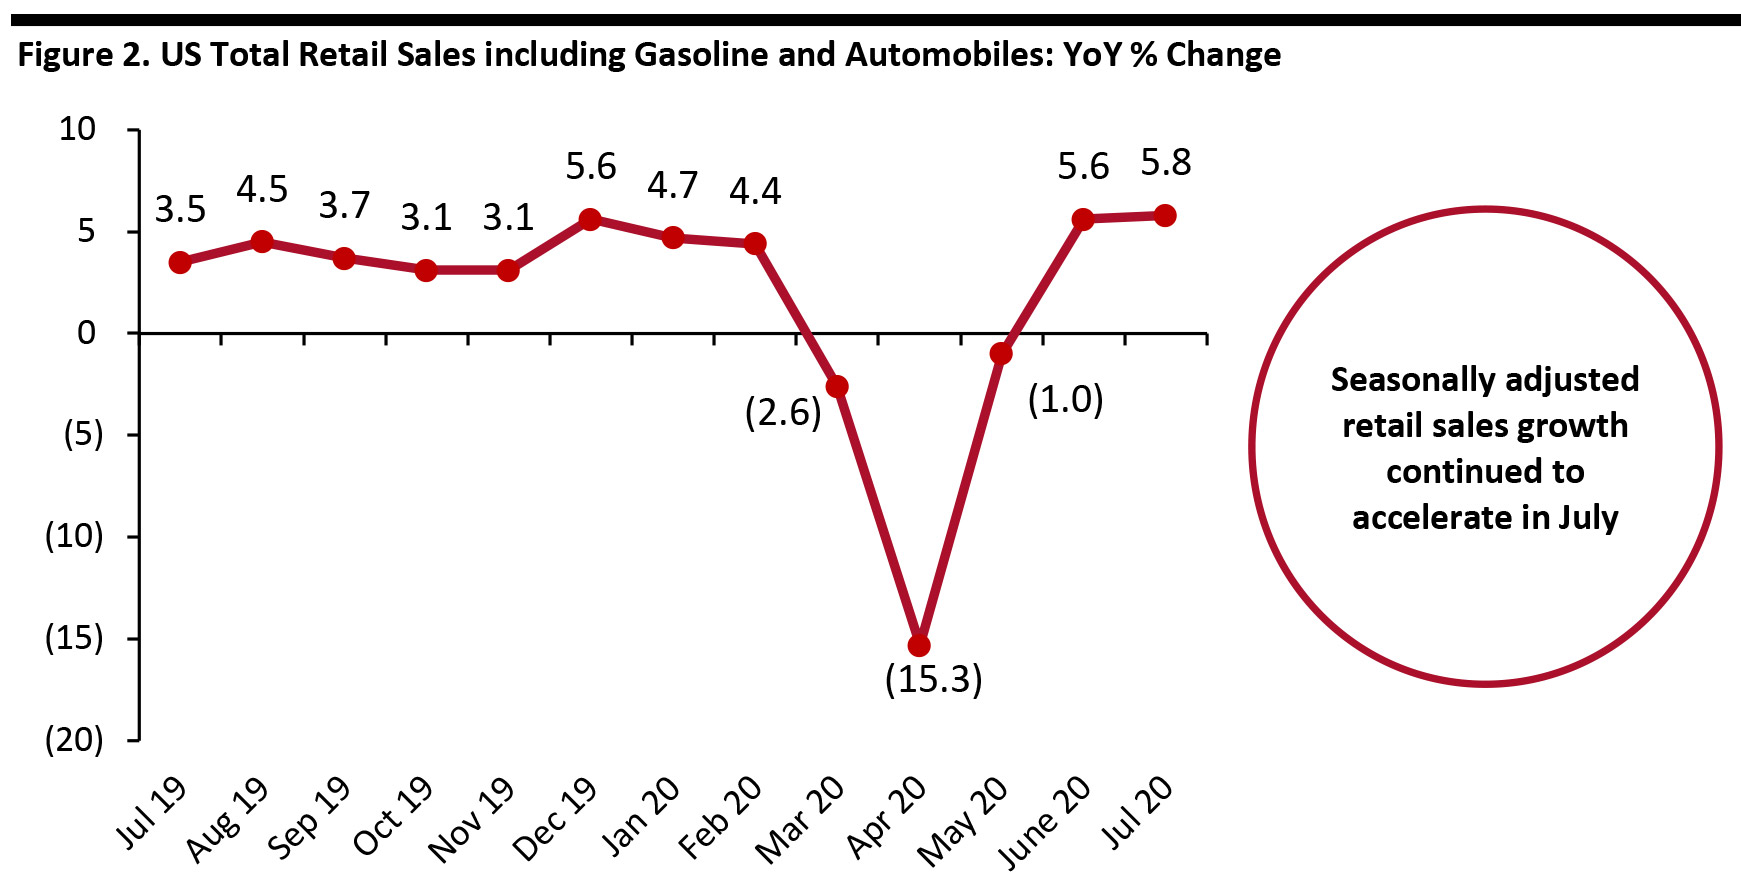
Source: US Census Bureau/Coresight Research [/caption] Retail Sales Increase Month over Month The Census Bureau’s core metric is seasonally adjusted retail sales including automobiles and gasoline. Year-over-year sales growth by this measure stood at 5.8% in July, up from June’s 5.6%. On a month-over-month basis and seasonally adjusted, retail sales grew 0.8% in July. [caption id="attachment_114470" align="aligncenter" width="700"] Data are seasonally adjusted
Source: US Census Bureau [/caption] Retail Sales Growth by Sector A number of sectors saw strong growth:
Figure 3. US Total Retail Sales, by Sector: YoY % Change [wpdatatable id=386 table_view=regular]
Data are not seasonally adjusted Source: US Census Bureau/Coresight Research
 Data are not seasonally adjusted
 Source: US Census Bureau/Coresight Research [/caption] Retail Sales Increase Month over Month The Census Bureau’s core metric is seasonally adjusted retail sales including automobiles and gasoline. Year-over-year sales growth by this measure stood at 5.8% in July, up from June’s 5.6%. On a month-over-month basis and seasonally adjusted, retail sales grew 0.8% in July. [caption id="attachment_114470" align="aligncenter" width="700"]
 Data are seasonally adjusted
 Source: US Census Bureau [/caption] Retail Sales Growth by Sector A number of sectors saw strong growth:
- Home-improvement stores (building-material and garden-supply retailers) saw a 16.0% increase. This impressive growth supports our expectation that home-improvement retailers will be the fastest-growing store-based nonfood sector this year.
- Even with more stores being open, nonstore retailers maintained their growth momentum, including for essentials: The sector, which includes e-commerce firms, saw sales growth of 25.8% in July, following June’s 31.3% increase.
- Sports and leisure goods retailers saw a 18.9% increase in sales. This sector is a mix of diverse nonfood subsectors and reflects a jump in demand for selected discretionary categories, even as clothing and department stores saw sales down year over year (see below).
- Sales growth at grocery stores accelerated to 12.3% in July, from 10.4% in June. In July, grocery-store sales growth remained slightly below the overall food sector’s 12.8% growth.
- Health and personal care stores saw sales increase by 3.1% in July after June’s 2.3% growth. This figure masks a polarization between essential retailers such as pharmacies and discretionary retailers such as beauty stores—which had shuttered stores from March but recovered substantially in June and July due to lockdowns easing and stores reopening.
- Furniture and home-furnishing stores posted a 0.5% sales increase in July versus 1.0% growth in June.
- Clothing-store sales declined by 19.6% in July after plunging 25.7% in June, representing a 23.7% increase sequentially (a percentage on a percentage, not a percentage-point increase). This compares to sequential improvements of 88.1% for electronics and appliance stores and 25.9% for department stores, on the same basis. For 2020, we expect the clothing-store sector to underpace growth in consumer spending on apparel.
- Sales at department stores (a subset of general-merchandise stores and weighted toward apparel) declined by 10.6% in July versus June’s 14.3% fall.
Figure 3. US Total Retail Sales, by Sector: YoY % Change [wpdatatable id=386 table_view=regular]
Data are not seasonally adjusted Source: US Census Bureau/Coresight Research