Nitheesh NH
Our US Monthly Retail Traffic and In-Store Metrics Report reviews year-over-year changes in selected store-based metrics, including sales, traffic and conversion rates.
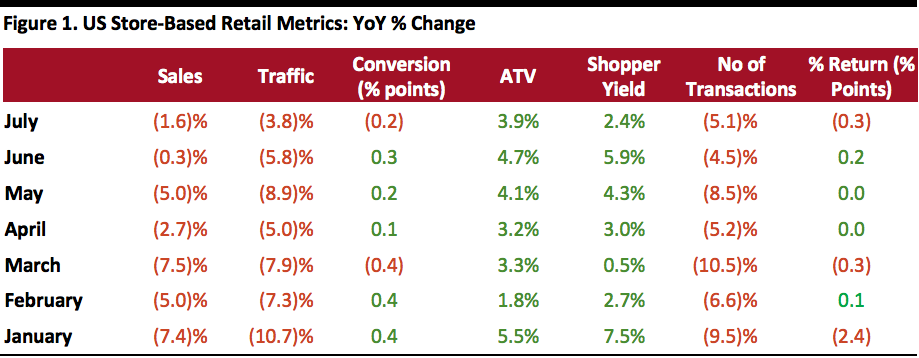 ATV = average transaction value, % Return = percentage of goods returned to stores
Source: RetailNext[/caption] Data for July showed that performance varied over the course of the four weeks:
- US store-based traffic continued to fall in July, according to RetailNext. Retail traffic declined 3.8% year over year in July, slower than the 5.8% decline in June and the 8.9% fall in May.
- The conversion rate (sales transactions as a percentage of traffic) declined 0.2 percentage points in July after it advanced 0.3 percentage points and 0.2 percentage points in June and May, respectively.
- The product return rate declined 0.3 percentage points in July after it advanced 0.2 percentage points in June.
- Average transaction value (ATV, sales divided by transactions) grew 3.9% in July, slower than the 4.7% and 4.1% growth reported in June and May, respectively.
- Shopper yield (sales divided by traffic) grew 2.4% year over year in July, slower than the 5.9% and 4.3% increases in June and May, respectively.
ATV = average transaction value, % Return = percentage of goods returned to storesSource: RetailNext[/caption] Data for July showed that performance varied over the course of the four weeks:
- The first week of July, the week after the Independence Day weekend, performed the best as traffic increased 2.1% year over year and sales increased 9.1% year over year.
- July 16, the second day of Amazon Prime Day, reported low performance in traffic as customers preferred to shop online versus offline. However, year over year sales were up compared to Amazon Prime Day last year.
- August 3 performed best for sales, traffic and transactions, August 2 performed best for conversion.
- Sales, shopper yield and transactions were lowest on July 10.