Web Developers
 Source: Company reports
Costco’s July Comps Beat Expectations; Strong Sales Growth led by a Surge in Customer Traffic
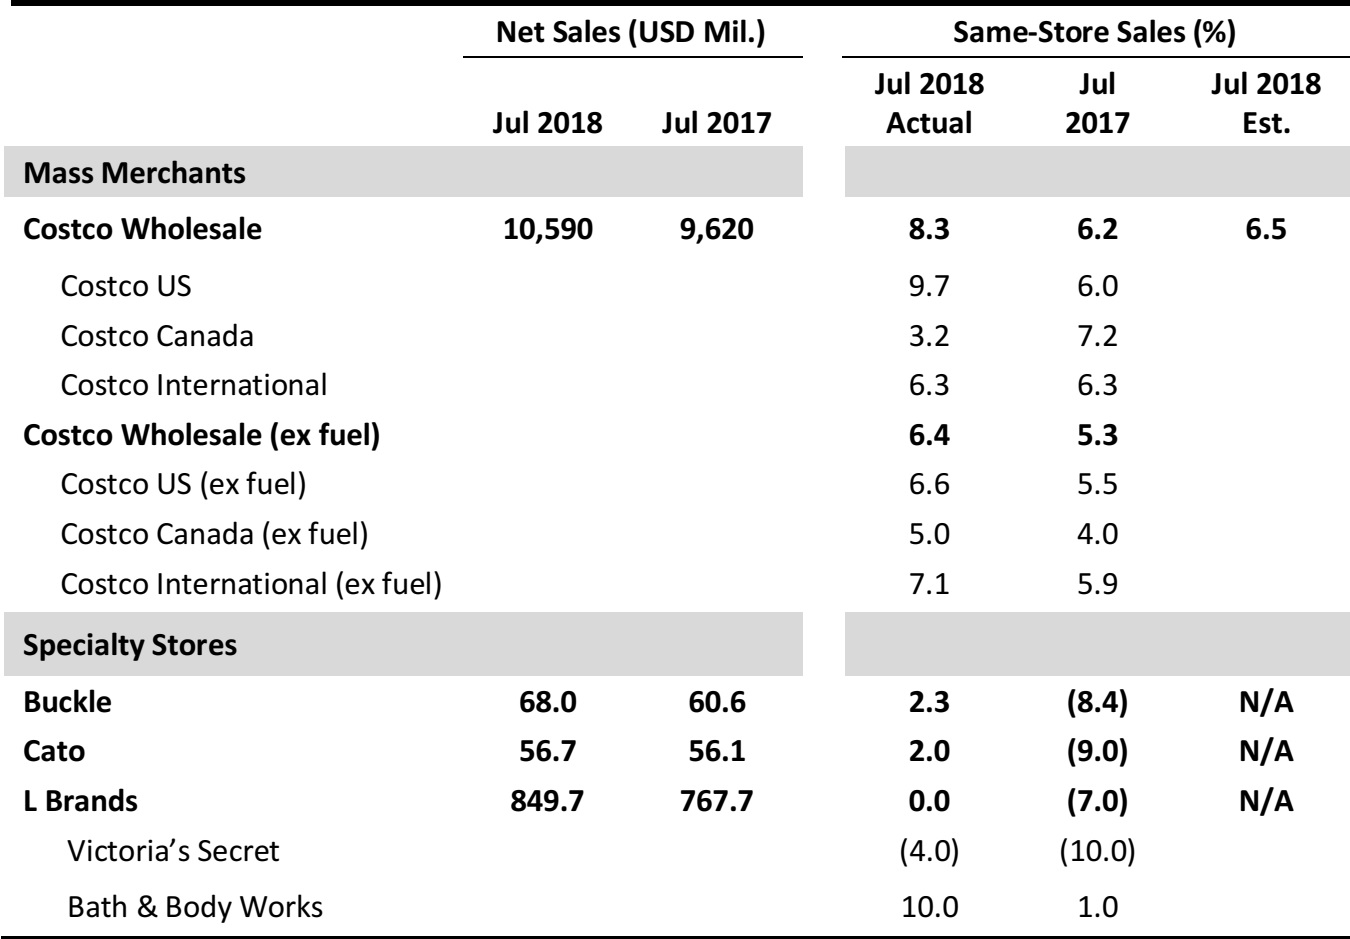
- Costco’s July same-store sales grew by 8.3% year over year, beating the consensus estimate of 6.5%.
- Costco’s e-commerce comp sales were up 20.9% in July, lower compared to the 27.7% growth reported in June. In July, traffic at Costco was up 4.7% worldwide and up 4.5% in the US.
- In terms of regions, the US witnessed the strongest results in the Midwest, Southeast and San Diego. Internationally, Costco saw strong sales growth in Spain, Japan and Mexico.
- Cannibalization negatively impacted total company sales by over 50 basis points. US sales were impacted by slightly less than 50 basis points. Canada sales were also negatively impacted, by over 50 basis points. The negative impact on the remaining international sales was slightly less than 100 basis points.
- Food and sundries same-store sales were up by mid-single digits. Departments that saw the strongest comp growth were tobacco, liquor and frozen foods. Hardlines were up by mid- to high-single digits. The better-performing departments included majors, hardware and tires. Sales in the majors department were up in the higher-single digits, driven by tablets, appliances and computers.
- Softline comps grew by mid- to high-single digits. Departments that performed well included housewares, jewelry and small appliances. Fresh foods was up by mid-single digits, with bakery and service deli among the better-performing departments.
- In the ancillary business segment, gasoline, hearing aids and food courts saw the best comp sales increases during the month. Gasoline price inflation added approximately 275 basis points to Costco’s total reported comp sales. The average selling price was up 26%, to $2.99, compared with $2.38 last year.
L Brands Reported Flat Comp Growth; Decline in Traffic Weighed on Comps
- L Brands’ comps stood flat in July. Victoria’s Secret’s comps fell by 4% and Bath & Body Works’ comps were up 10%.
- L Brands’ merchandise margin rate was down significantly in July compared to last year, and below expectations, due to promotional activity at Victoria’s Secret.
- Inventories per square foot as of the end of July grew 13% year over year.
- At Victoria’s Secret, growth in beauty was more than offset by a decline in the Lingerie and PINK businesses which resulted in a 4% fall in the comps.
- In August, the company plans to focus on new fashion in the Body by Victoria collection in the Lingerie business and back-to-school in the PINK business.
- At Bath & Body Works, comps increased by 10%, driven by strong product acceptance. The brand’s merchandise margin for the month was up compared to last year, driven by lower promotional activity and a calendar shift of semiannual sales days into June.
- Traffic for Victoria’s Secret showed a mid-single decline, while traffic for Bath & Body Works declined in the low- to mid-single digits.
Buckle Reported Strong Sales Growth led by a Modest Increase in Comps; the Men’s Business Outperformed the Women’s Segment
- Buckle’s comps increased by 2.3% year over year in July, following an 8.4% decrease year over year in the same month last year.
- Total sales in the men’s business grew 6.5% year over year. The men’s segment accounted for 52.5% of total sales compared with 51.0% in the same month last year. Price points were down 1.5% for July in the men’s segment.
- Total sales for the women’s segment were down 2.0% year over year. The women’s segment accounted for 47.5% of total monthly sales versus slightly higher 49% last July. Price points were down 3.0% in the women’s business.
- Accessories sales fell 3.5% year over year in July and accounted for 9% of total sales, versus 10.5% in July 2017. Footwear sales grew by 9.5% and represented 6.0% of total sales, flat versus July 2017. Average accessory price points were down 4.5% and average footwear price points were up 4.5%
- In July, units per transaction increased by 3% and the average transaction value increased by about 0.5%, year over year.
Cato Reports Positive Growth in Sales and Comps
- Cato’s sales grew by 1.0% to $56.7 million, while comps increased 2% year over year.
- As of August 4, 2018, the company operated 1,350 stores in 33 states, down from 1,374 in the year-ago period. Cato did not add or close any of its stores in the current month.