Web Developers

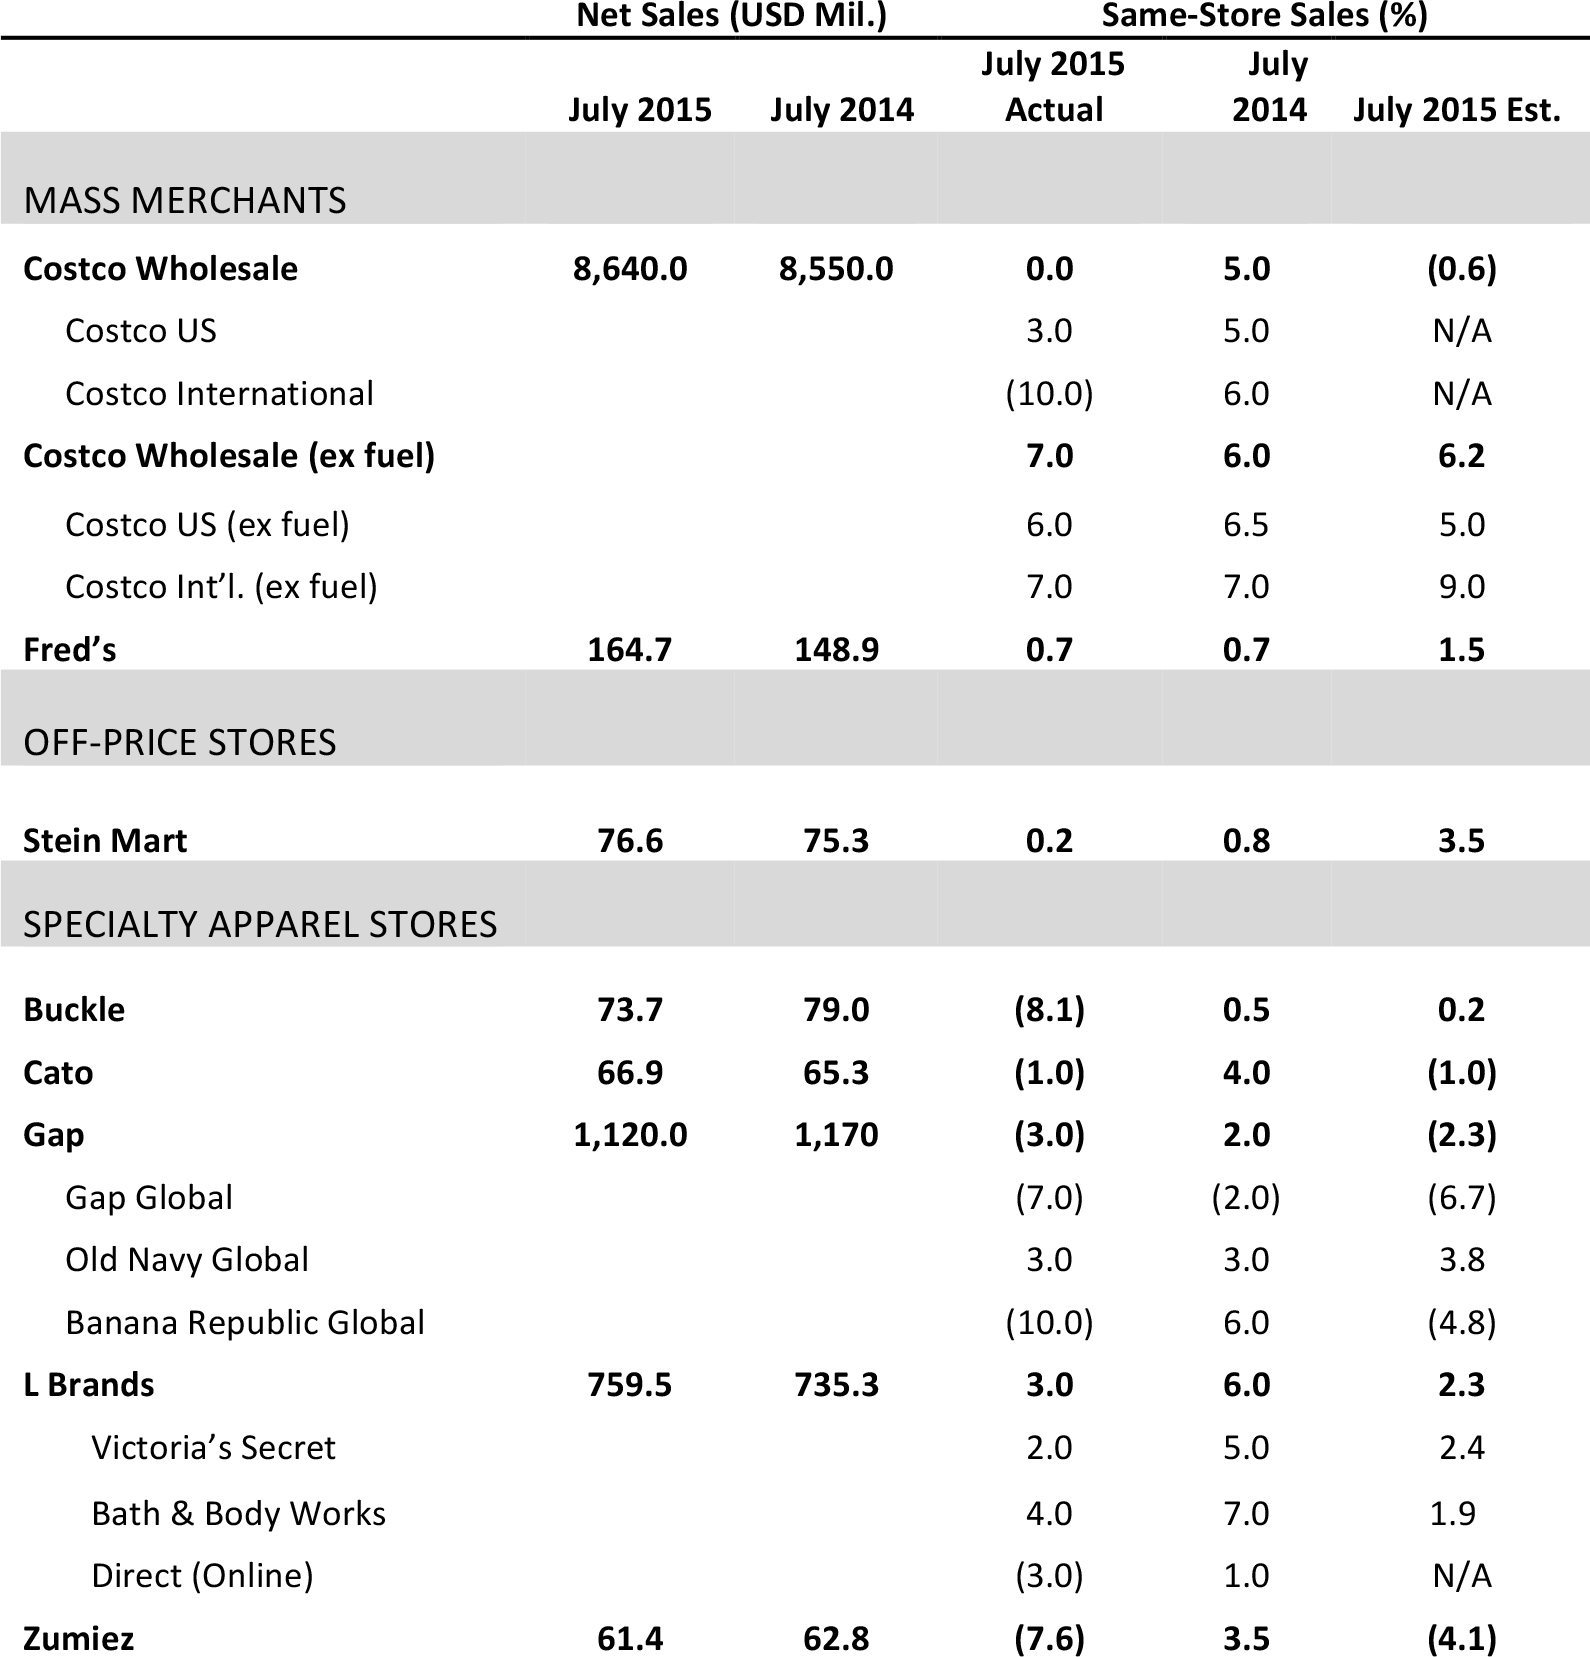
Costco Posted Flat July Comps, Beating Estimates
- The five-week July period had 28 selling days both this year and last year.
- Costco’s flat comparable sales growth in July beat analysts’ estimates of (0.6)%. When excluding the impact of fuel, comp sales were up 7%.
- Within the US, the strongest sales regions were Los Angeles, San Diego, Texas and the Midwest. Internationally, Australia, Mexico and South Korea posted strong sales, as they have in recent months.
- Food and sundries saw low to mid-single-digit comps. The deli, liquor and sundries subcategories posted the strongest results. Food was slightly inflationary in July.
- In the hardline category, sporting goods, seasonal, office and hardware were the top performers, posting high single-digit sales. Consumer electronics comp sales were negative for the month.
Fred’s 11% Increase in July Total Sales Did Not Meet Management Expectations
- Value store Fred’s total sales in July increased by 11%, to $164.7.9 million, up from $148.9 million in July 2014. Total sales growth would have been 16%, had $5.6 million from last year’s 57 closed stores not been excluded.
- Same-store sales for the month increased by 0.7%, similar to the same period last year.
- Recent specialty pharmacy expansion accounted for 12% of total sales. However, July sales did not meet the company’s internal expectations. Fred’s continues to confront strong headwinds in pharmacy sales, such as regulation of controlled substances, a greater uninsured population due to lower-than-average health insurance participation and continued pressure on reimbursement rates.
Stein Mart Posted Weak July Comps Due to Shift of Tax Holidays in Eight States
- July comps at Stein Mart were affected by the shift of sales tax holidays from July to August in eight states, which impacted 102 stores, and by higher liquidation sales due to three store relocations last year.
- The Midwest and Southwest posted the strongest sales, while the Northeast, Southeast and California had weak results. The Northeast and Southeast were affected by the shift of sales tax holidays.
- “We are pleased with our second quarter sales results, despite the weaker July which was clearly not in line with our current trend,” said CEO Jay Stein.
Buckle Posted Weak July Sales, Driven by Similar Categories in Men’s and Women’s
- Teen retailer Buckle’s overall comps declined by 8.1% in July: women’s categories decreased by 11% and men’s were up by 0.5%.
- The women’s section accounted for 55% of total monthly sales versus 57.5% last year. The total sales portion for men’s categories increased to 45% from 42.5% last year.
- Popular men’s categories included casual bottoms, knit shirts, shorts and accessories. On the women’s side, casual bottoms, shorts, dresses and woven tops were popular sellers.
Cato’s July Comp Sales Results Below Recent Flat Trends
- Cato reported sales of $249.2 million for the four weeks ended August 1, 2015, up 2%, from $243.8 million, on August 2, 2014.
- “July same-store sales were slightly below our current trend of flat,” said John Cato, Chairman, President, and CEO. “We now expect second quarter earnings per diluted share to be near the high end of our original range of $.54 to $.57 vs. $.56 last year, a decrease of 4% to an increase of 2%.”
Gap Inc. Total Same-Store Sales Dropped 3% in July, Missing Analysts’ Estimates
- Gap’s July comp sales were down 3%. Total net sales were $1.12 billion in July, down from $1.17 billion last year.
- The shift of tax-free holidays from July last year to August this year negatively impacted July sales. It is also important to note that Labor Day falls a week later this year.
- On a reported basis, the company expects per-share earnings of $0.51 and $0.52.
L Brands Reported a 3% Increase in July Comps, Missing Wall Street Expectations
- July comps were up 2% at Victoria’s Secret and up 4% at Bath & Body Works. Total comps were affected by about one point by foreign exchange.
- Victoria’s Secret Direct’s sales declined by 3%, as significant growth in core categories was more than offset by the exit of apparel in this channel.
- Overall inventory per square foot was flat year over year, while the merchandise margin rate was up compared to last year.
- The company expects August comps to be up, in the low single-digit range, and to be affected by a late Labor Day this year.
Zumiez’s July Comps Declined by 7.6%, Driven by Decreased Comparable Transactions
- Zumiez’s July comps declined by 7.6%, whereas they had increased by 3.5% in July 2014.
- July’s decrease was driven by a drop in comparable transactions, which was partially offset by an increase in dollars per transaction.
- During the four-week July period, the men’s, accessories, footwear, juniors and hard goods categories posted negative comps. As in recent months, Europe significantly outperformed other regions.
- The company experienced significant pressure due to the Labor Day and tax holiday calendar shift.