albert Chan
US Retail Traffic and In-Store Metrics: January 2022
The Coresight Research US Retail Traffic and In-Store Metrics series reviews changes in selected store-based metrics, as reported by RetailNext. In this month’s report, we review store traffic changes through January 2022—which saw a slight deceleration in traffic growth compared to December, with trends impacted by a rise in Covid-19 cases. Year-over-year changes are our core metric for store-based data; however, all March–July 2021 data in this report are compared to 2019 (pre-pandemic), since stores began closing in March 2020 due to Covid-19 and there were widespread store closures in April, May, June and July 2020. For data from August 2021 onward, the comparison reverts to year over year. January 2022 saw decelerated growth in traffic trends. Traffic registered 26.9% growth in January, lower than December 2021’s 32.6% increase year over year. In January, ATV (average transaction value, or sales divided by transactions) increased by 10.9%, just 0.8 percentage points lower than December’s growth of 11.7%, reflecting a trend toward fewer shopping trips (less visits, larger baskets) due to the increase in Covid-19 cases.- The conversion rate (sales transactions as a percentage of traffic) decreased by 1.7 percentage points in January, deteriorating from December’s 0.9 percentage points decline.
- Shopper yield (sales divided by traffic) increased by 0.7% in January versus December’s 7.4% growth year over year.
- Unit per transaction (number of items purchased divided by number of transactions) decreased by 4.5% in January versus December’s 6.9% decline.
- Average unit retail (net sales divided by units sold) increased by 16.9%, down from December’s 19.4% growth.
Figure 1. US Store-Based Traffic and Sales: YoY % Change [caption id="attachment_141942" align="aligncenter" width="700"]
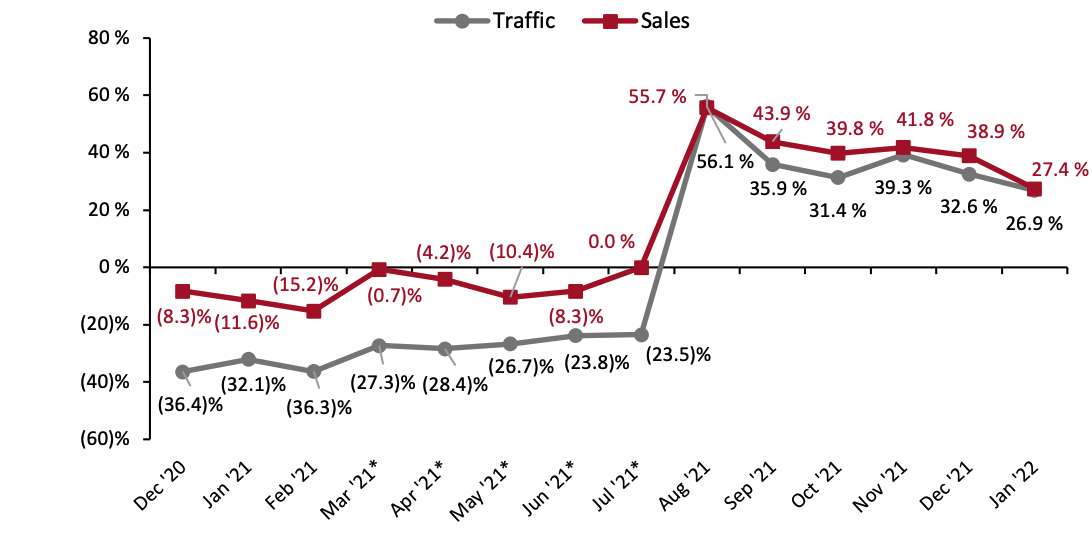 *March–July 2021 numbers are two-year % change due to store closures in the comparable period in 2020
Source: RetailNext[/caption]
Figure 2. US Store-Based Nonfood Retail Metrics: YoY % Change [caption id="attachment_141943" align="aligncenter" width="700"]
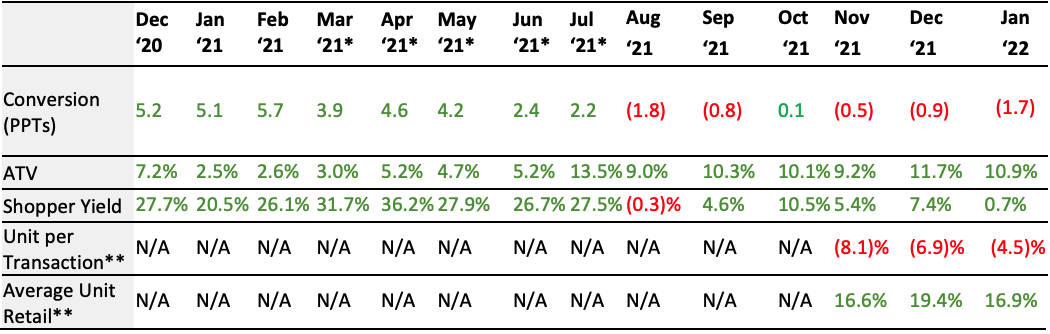 ATV=average transaction value; Shopper yield=Sales divided by traffic
*March–July 2021 numbers are two-year % change due to store closures in the comparable period in 2020
**RetailNext started providing data on these from November 2021
Source: RetailNext[/caption] Weekly Shopper Traffic Trends Weekly data for January tracks the progress of store traffic over four weeks (January 2, 2022–January 29, 2022):
- On a week-by-week basis, traffic performance displayed a mixed trend as the month progressed, recording the strongest performance in the first week on a year-over-year basis and the weakest in second week due to a rise in Covid-19 cases.
- In the first week of January, traffic increased by 29.5%—deteriorating from the final week of December, which saw a traffic increase of 31.8%. Traffic growth decelerated to 23.3% in the second week of January before accelerating to 24.7% in the third week and 28.4% in the fourth week.
- Apparel was the strongest performing category in January, increasing by 40.8% year-over-year, as consumers were shopping for going out and returning to travel.
- Footwear was the second strongest category in January, increasing by 33.3% year-over-year, but 620 basis points lower than December.
- The health and beauty category saw a traffic increase of 30.0% on a year-over-year basis, about 100 basis points lower than December.
- Traffic in the jewelry category increased by 19.8% year-over-year, declining 900 basis points from December.
- The home category saw the softest growth compared to other categories, recording a 6.5% increase year over year, 190 basis points higher than December.
Figure 3. US Retail Traffic by Industry Vertical: YoY % Change [caption id="attachment_141944" align="aligncenter" width="700"]
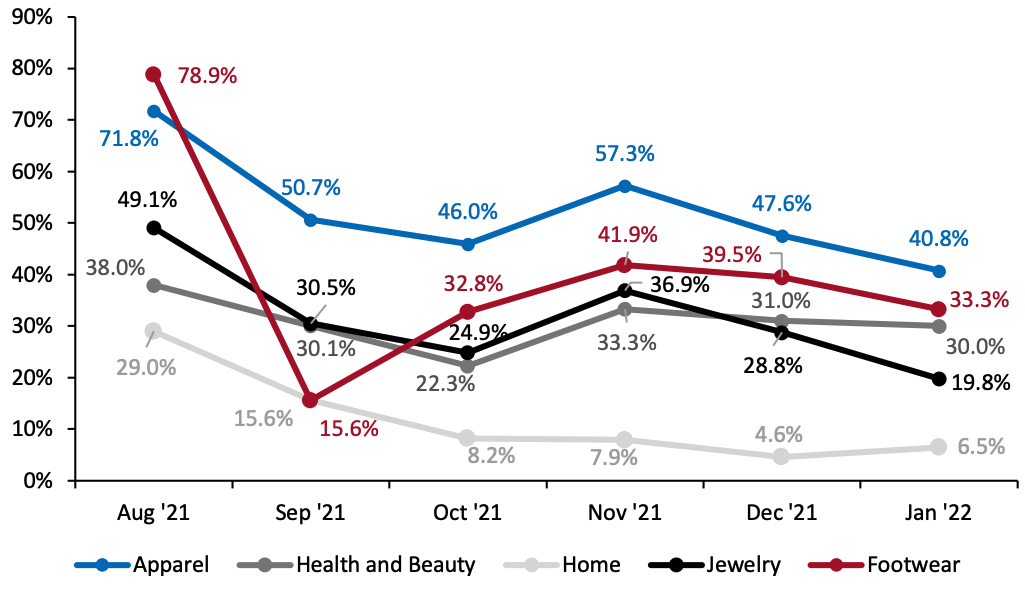 RetailNext started providing traffic trends by vertical on a year-over-year basis from August 2021
Source: RetailNext[/caption] Regional Traffic Trends In mid-January, Covid-19 cases peaked in number as the Omicron variant spread rapidly across the US. During the first week of the month, Chicago residents had to show proof of full vaccination to enter indoor public places. Starting January 15, the District of Columbia required proof of at least one vaccination dose to enter fitness centers, restaurants and entertainment facilities. The Northeast and South region experienced significant snowfall and ice due to winter storms. Retail traffic in January varied across regions:
- The West region performed best, as traffic increased by 37.5% year over year. The second and third weeks had the softest traffic trends compared to other weeks, mainly due to a rise in Covid-19 cases.
- The traffic in the Northeast performed second best, increasing by 29.5% compared to 2020. The first week saw the best trend in traffic compared to other weeks. The second week saw the lowest trend in traffic owing to a rise in Covid-19 cases.
- The South’s traffic increased by 20.6% year over year. The third week saw a decline in traffic trends due to the winter storm which struck states including North Carolina, Georgia and Virginia.
- The Midwest’s traffic increased by 17.1% year over year. For the first three weeks, traffic trends were lower compared to all other regions. In the third week, Ohio had the lowest comp, due to the effects of a winter storm.
- Traffic by mall location type increased between 14.0% and 46.1% year over year.
- Luxury locations performed best compared to all other location types, increasing by 46.1%.
- Other locations, including airports, casinos and hotels, performed next best with traffic increasing by 42.0%, followed by lifestyle centers, which saw a 35.1% traffic increase year over year.
- Outlet locations saw a traffic increase of 31.0% and traditional malls registered growth of 30.4%, respectively.
- Street-front/freestanding locations registered growth of 29.7% while strip malls saw traffic growth of 14.0% year over year.