DIpil Das
The Coresight Research US Retail Traffic and In-Store Metrics series reviews year-over-year changes in selected store-based metrics, as reported by RetailNext. In this month’s report, we review store traffic changes through January 2021, amid an initial increase in case numbers in the month, followed by declines that have continued into February and increased vaccine distribution throughout the US. RetailNext’s coverage does not include food retailers but does include some other retail sectors deemed essential; the exclusion of food retail means that the figures cited below almost certainly overstate recent declines in total retail traffic.
These traffic trends support Coresight Research’s findings on a gradual return to normal activities among US consumers.
Figure 1. US Store-Based Nonfood Retail Metrics: YoY % Change [caption id="attachment_123505" align="aligncenter" width="725"]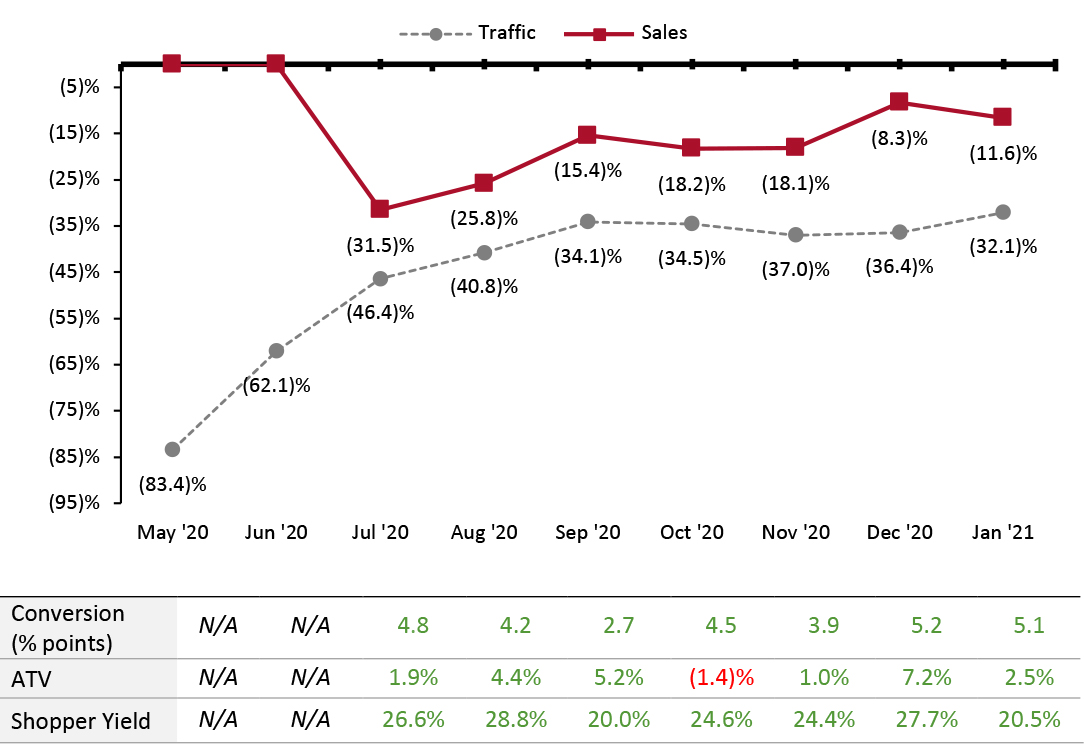 ATV=average transaction value; Shopper yield= Sales divided by traffic
Source: RetailNext [/caption] Weekly Shopper Traffic Trends Weekly data for January tracks the progress of store traffic over four weeks (January 3, 2021–January 30, 2021):
Figure 2. US Retail Traffic by Industry Vertical: YoY % Change [caption id="attachment_123506" align="aligncenter" width="725"]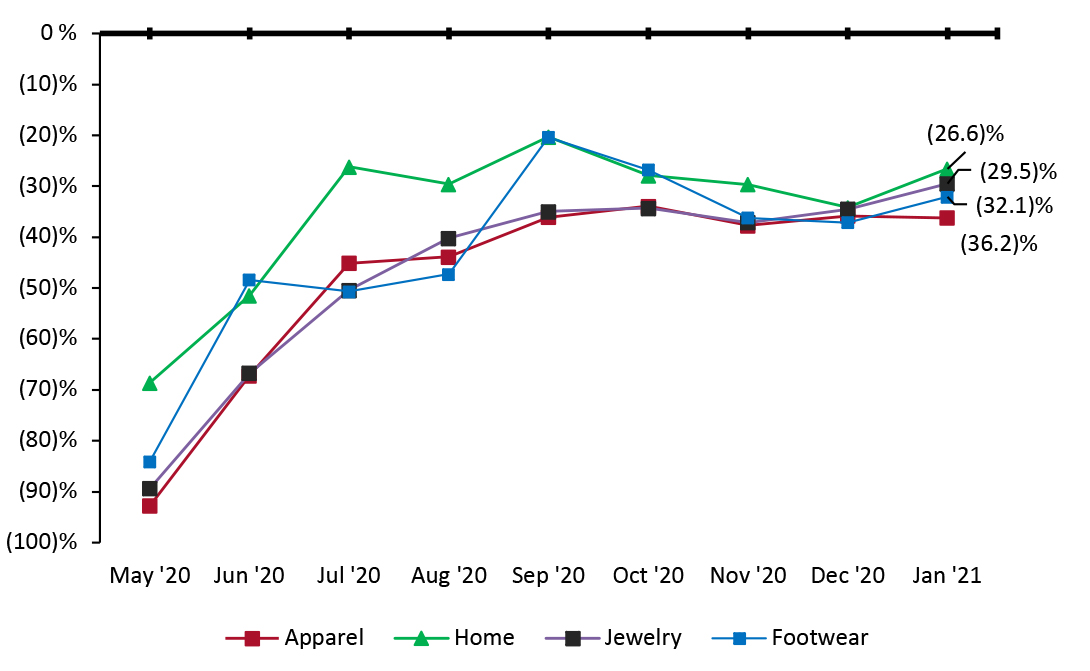 Source: RetailNext[/caption]
Regional Traffic Trends
January witnessed high Covid-19 case levels in the first two weeks, likely due to people traveling for the holidays. The US Center for Disease Control and Prevention (CDC) imposed new travel restrictions on tourists entering the US and banned travel to countries with new virus strains. Over 20 states reported infections from new virus variants of, with California witnessing the most significant impact. The overall case and hospitalization numbers slowed down across the country in the last two weeks of January. The decline in Covid-19 cases and increase in vaccination activities will likely have a positive impact on traffic trends in the coming months, as people will feel more comfortable going out and visiting stores.
Retail traffic in January varied across regions:
Source: RetailNext[/caption]
Regional Traffic Trends
January witnessed high Covid-19 case levels in the first two weeks, likely due to people traveling for the holidays. The US Center for Disease Control and Prevention (CDC) imposed new travel restrictions on tourists entering the US and banned travel to countries with new virus strains. Over 20 states reported infections from new virus variants of, with California witnessing the most significant impact. The overall case and hospitalization numbers slowed down across the country in the last two weeks of January. The decline in Covid-19 cases and increase in vaccination activities will likely have a positive impact on traffic trends in the coming months, as people will feel more comfortable going out and visiting stores.
Retail traffic in January varied across regions:
- January saw an improvement in traffic trends: Traffic declined by 32.1% year over year in January versus December’s 36.4% decline.
- The conversion rate (sales transactions as a percentage of traffic) grew by 5.1 percentage points in January, in line with December’s 5.2-percentage-point growth.
- In January, ATV (sales divided by transactions) declined sharply to 2.5%, versus December’s 7.2% growth.
- Shopper yield (sales divided by traffic) declined to 20.5% in January versus December’s 27.7% increase.
Figure 1. US Store-Based Nonfood Retail Metrics: YoY % Change [caption id="attachment_123505" align="aligncenter" width="725"]
ATV=average transaction value; Shopper yield= Sales divided by traffic Source: RetailNext [/caption] Weekly Shopper Traffic Trends Weekly data for January tracks the progress of store traffic over four weeks (January 3, 2021–January 30, 2021):
- Traffic declined by 29.7% in the first week of January, a deceleration from the final week of December, which saw a traffic decline of 32.4%. However, traffic declines accelerated to 31.1% in the second week of January.
- Declines accelerated in the third week of January to 33.0%, with more people opting to stay at home due to increases in Covid-19 cases in the first two weeks of January.
- Declines accelerated further to 33.9% in the fourth week of January.
- The apparel sector experienced the greatest traffic decline at 36.2%, a decline of 40 basis points compared to December.
- The footwear sector saw a 32.1% decrease in traffic, an improvement of 500 basis points compared to December.
- The home sector posted the lowest traffic decline, at 26.6%, an improvement of 760 basis points compared to December.
- The jewelry sector reported a traffic decline of 29.5%, an improvement of 500 basis points compared to December.
Figure 2. US Retail Traffic by Industry Vertical: YoY % Change [caption id="attachment_123506" align="aligncenter" width="725"]
Source: RetailNext[/caption]
Regional Traffic Trends
January witnessed high Covid-19 case levels in the first two weeks, likely due to people traveling for the holidays. The US Center for Disease Control and Prevention (CDC) imposed new travel restrictions on tourists entering the US and banned travel to countries with new virus strains. Over 20 states reported infections from new virus variants of, with California witnessing the most significant impact. The overall case and hospitalization numbers slowed down across the country in the last two weeks of January. The decline in Covid-19 cases and increase in vaccination activities will likely have a positive impact on traffic trends in the coming months, as people will feel more comfortable going out and visiting stores.
Retail traffic in January varied across regions:
- The West was the worst-performing region, witnessing a traffic decline of 36.2%. California’s statewide shelter-in-place restrictions impacted the West region heavily. With improvements in Covid-19 cases and the reopening of many counties in California around the last week of January, week four traffic in the region deaccelerated to 35.7%.
- The Northeast posted a traffic decline of 29.4%. in January, an improvement of 10 percentage points over the last week of December. The traffic decline further improved in the second week, reaching 25.3%. However, the last two weeks saw a drop in traffic as cold weather hit the region.
- The South posted the second-best traffic performance, with a 27.6% decline. Traffic decline accelerated in the last three weeks of January, with week four posting a traffic decline of 29.1%.
- The Midwest outperformed all other regions with a traffic decline of 25% for the month. The region witnessed the best trends through the first three months. However, week four traffic decline accelerated by 10 percentage points to 33.5% in the region.
- Traffic by mall location type declined by between 18% and 48%, with strip malls outperforming all other location types by at least 12 percentage points, with a decline of only 18.3%. These locations benefited from being open-air and from the presence of nondiscretionary retailers, such as food retailers.
- Lifestyle center, outlet and traditional mall locations witnessed traffic declines of between 30.3% and 35.7%. Street-front and freestanding locations witnessed a decline of 30.7%, while luxury locations saw a decline of 44.5%.
- Other retail locations including airports, casinos and hotels were hit the hardest, with traffic declines of 47.9%, owing to travel restrictions as well as consumers avoiding tourist areas.